At its most basic level, a financial statement is a formal record that tells the story of a business's financial life. Think of it as a company's report card, giving investors, owners, and even lenders a clear, standardized look at how things are really going. These aren't just collections of numbers; they're detailed narratives.
Your First Look at a Company's Financial Story
Ever wonder how savvy investors seem to just know which stocks to pick? Or how a bank decides who is a good bet for a business loan? The answer almost always comes down to reading a company's financial story, told through its financial statements.
It helps to think of these reports like the dashboard of a car. One gauge tells you your current speed (your performance), another shows how much gas is left in the tank (your assets), and a third light warns you if the engine is running smoothly (your cash flow).
Taken together, these documents paint a complete picture of a company's financial journey, covering everything from its long-term stability to its profitability in the last quarter. Understanding what a financial statement is means knowing how to read this dashboard to make smart, informed decisions.
The Core Components of Financial Reporting
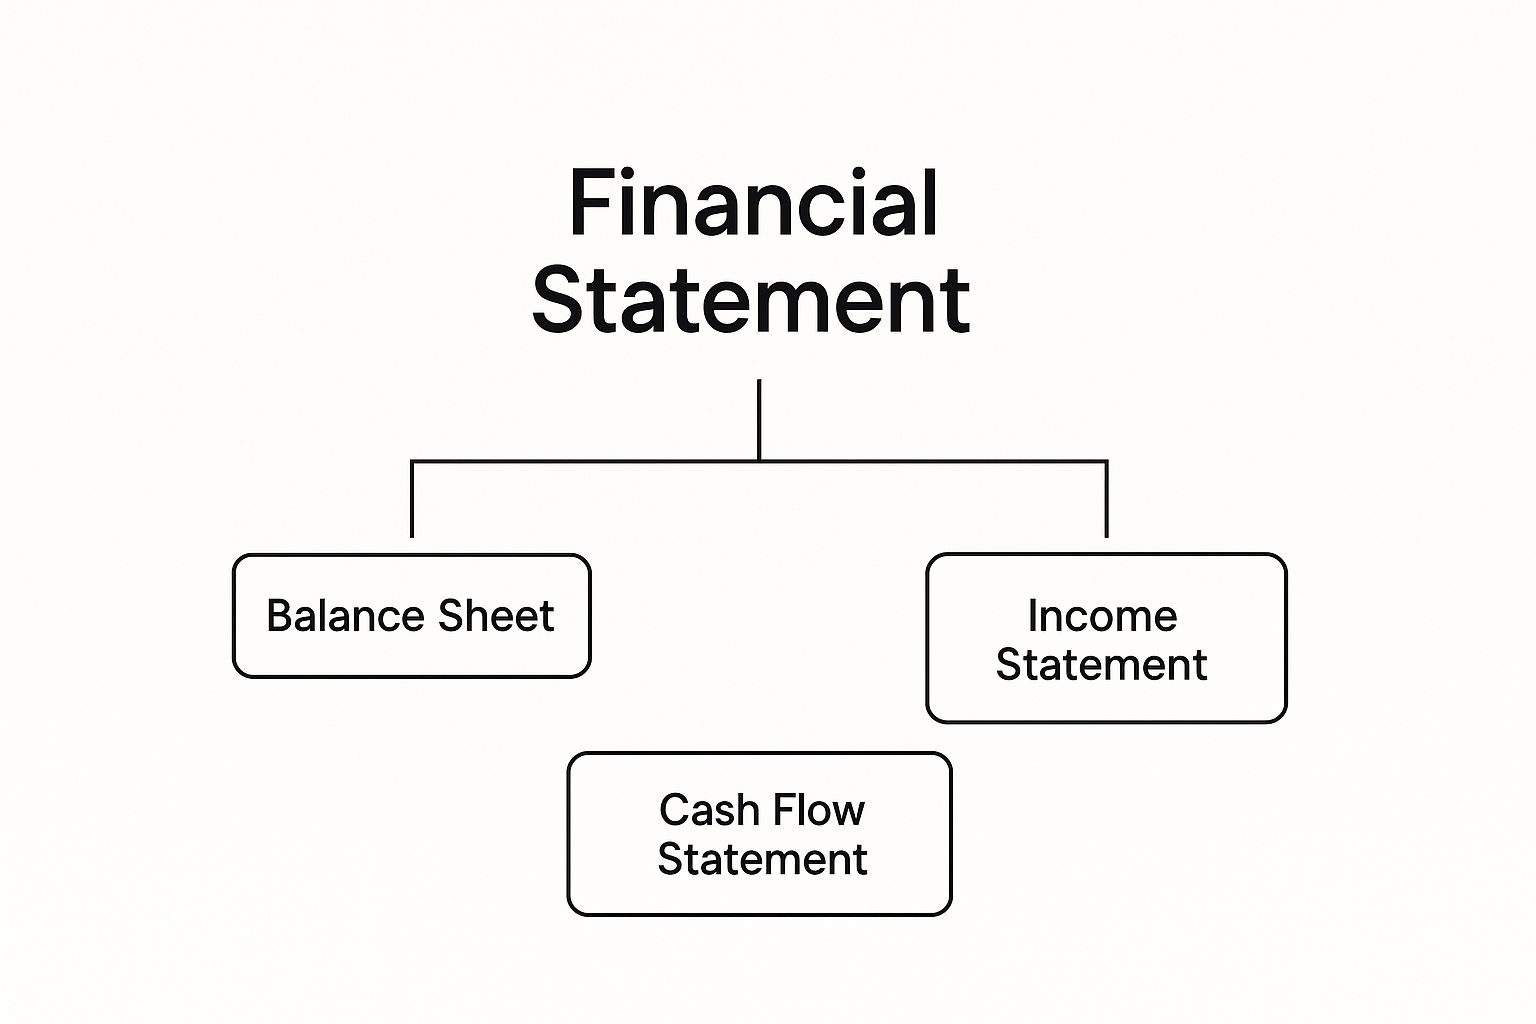
A full set of financial statements is built on three cornerstone reports, often called the "big three." Each one answers a different—but equally critical—question about the business.
- The Balance Sheet: What does the company own and what does it owe at a single point in time?
- The Income Statement: Did the company make a profit over a specific period (like a month or a year)?
- The Cash Flow Statement: Where did the company's cash actually come from, and where did it go?
This simple chart shows how the main concept of a "financial statement" breaks down into these three essential reports.
This structure is designed to give you a well-rounded view, preventing you from being misled by just one piece of the puzzle. For example, a company could look profitable on its income statement but be running out of cash fast—a problem the cash flow statement would immediately reveal.
To give you a clearer picture, here’s a quick summary of how these three core statements work together.
The Three Core Financial Statements at a Glance
| Statement Name | What It Shows | Time Frame | Key Question Answered |
|---|---|---|---|
| Balance Sheet | Assets, Liabilities, and Equity | A single point in time (e.g., "as of Dec. 31") | What is the company's net worth? |
| Income Statement | Revenues, Expenses, Profits, and Losses | A period of time (e.g., "for the quarter ended…") | Is the company profitable? |
| Cash Flow Statement | Inflows and outflows of cash from operations, investing, and financing | A period of time (e.g., "for the year ended…") | How does the company manage its cash? |
Each report provides a unique lens, and only by looking through all three can you get a true sense of a company's financial health.
Interestingly, the modern format for these statements became standardized as a way to protect investors and demand transparency. After the historic stock market crash of 1929, the U.S. government established the Securities and Exchange Commission (SEC), which made these standardized reports mandatory for all public companies.
Getting a handle on these documents is a cornerstone of financial literacy. In fact, many successful entrepreneurs rely on solid small business bookkeeping tips to make sure their own financial records are accurate and insightful right from the start.
A business without clear financial statements is like a ship navigating without a map, compass, or rudder. It might be moving, but no one knows where it's going, what dangers lie ahead, or if it has enough fuel to complete the journey. These reports provide the essential tools for navigation.
Understanding the Balance Sheet: A Financial Snapshot
If you think of the income statement as a movie telling the story of your business over a year, then the balance sheet is a single, high-resolution photograph. It captures a precise moment in time, showing exactly what your business owns and what it owes on one specific day.
That’s why you’ll always see a balance sheet dated for a single point in time, like "As of December 31, 2023." It’s not tracking performance over a month or a quarter; it’s a freeze-frame of your company's financial position, which can and does change every single day.
The entire report hangs on one fundamental, unbreakable rule: Assets = Liabilities + Equity. This isn't just a suggestion—it's an equation that must always balance. If it doesn't, you know right away there’s an error somewhere in your accounting.
Deconstructing the Balance Sheet Formula
So, what do these terms actually mean? Let’s break down the equation into plain English, maybe by thinking about it in personal terms first.
-
Assets: This is all the valuable stuff the company owns. Personally, this would be your house, your car, and the cash in your savings account. For a business, it’s things like cash on hand, inventory waiting to be sold, equipment, and company-owned buildings.
-
Liabilities: This is everything the company owes to other people or businesses. For an individual, that’s your mortgage, car loan, and credit card debt. For a business, we’re talking about bank loans, bills from suppliers (known as accounts payable), and other debts.
Which brings us to the final, and perhaps most important, piece of the puzzle: equity. It’s simply what’s left over when you subtract what you owe from what you own.
Equity is the owners' actual stake in the company. Think of it this way: if the business were to sell every single asset and use that cash to pay off every single liability, the money left over would be the equity. It’s the true measure of a company's net worth.
A Real-World Example
Let's put this into practice with a small bakery.
Imagine the bakery’s assets include $10,000 in cash, $15,000 worth of ovens and mixers (equipment), and $5,000 in flour and sugar (inventory). Add it all up, and you get $30,000 in total assets.
Now for the other side. The bakery took out a $12,000 loan to buy its equipment and still owes its suppliers $3,000 for the last delivery of ingredients. These are its liabilities, which total $15,000.
Using our trusty formula, we can calculate the owner's equity:
$30,000 (Assets) – $15,000 (Liabilities) = $15,000 (Equity)
Just from that one snapshot, you can see the bakery has a net worth of $15,000. By looking at a balance sheet, you can get a quick, clear read on a company's financial stability and solvency. It provides the perfect foundation for understanding its overall financial health before you even start looking at profit or cash flow.
Reading the Income Statement for Profitability
https://www.youtube.com/embed/cSj4iGmML08
While the balance sheet gives you a single snapshot in time, the income statement is more like a movie. Often called the Profit and Loss (P&L) statement, its job is to show you exactly how much money a business made or lost over a specific stretch—be it a month, a quarter, or a full year.
Think of it like your personal budget. You track all the money you earned for the month, then subtract everything you spent on rent, groceries, and bills. Whatever is left is what you saved. The income statement does the same thing for a company, telling a clear story from the first dollar of sales down to the final profit.
This top-to-bottom story is incredibly revealing. It shows how efficiently the company operates and answers the most important question of all: "Is this business actually profitable, or is it just busy moving money around?"
From Gross Revenue to Net Income
The income statement has a natural, logical flow, peeling back layers of costs to get to the true profit. It always starts with revenue, the total amount of money brought in from sales before a single expense is taken out. But that's just the starting point.
First, you subtract the Cost of Goods Sold (COGS). These are the direct costs tied to creating the product or service. For a bakery, COGS would be the cost of flour, sugar, and eggs. What’s left after subtracting COGS is the gross profit.
Next come the operating expenses. These are the costs of keeping the lights on and the business running, even if they aren't tied to a specific product. This bucket includes things like:
- Salaries and wages
- Rent for the office or store
- Marketing and advertising spend
- Utility bills
After subtracting these operating costs, plus any taxes and interest payments, you finally arrive at the famous "bottom line": the net income. This is the actual profit the company pocketed for the period.
A positive net income means the company made money. A negative one means it took a loss. This single number is one of the most-watched figures in the world of business.
This kind of detail is essential for making smart decisions. For example, a company like GlobalData reported a 4% underlying revenue growth and a profit before tax of £54.9 million—numbers that directly shape their strategy and build confidence with shareholders. As detailed in their investor reports on globaldata.com, these figures are a testament to the power of an accurate income statement in assessing a company's health.
Getting this financial story right requires precision. It's why so many businesses now rely on the best financial reporting software to ensure their P&L statements are accurate and insightful. Once you understand how to read this report, you can see exactly where a company’s money is going and truly judge its ability to earn a profit over the long haul.
Tracking Real Money with the Cash Flow Statement

The income statement can tell you a company is profitable, but that profit is really just an accounting figure. The cash flow statement, on the other hand, gives you the ground truth. It answers a much more practical question: where did the actual cash go? It meticulously tracks every dollar that physically moves in and out of the company’s bank accounts.
This is where that old business mantra, “cash is king,” really hits home. It’s entirely possible for a company to report millions in profit on paper but go bankrupt because it doesn't have enough cold, hard cash to pay its staff, suppliers, or rent. Think of this statement as your personal checkbook register, just for a business—it shows every single deposit and every single withdrawal.
Ultimately, this report connects the dots, showing exactly how the profit on the income statement translates to the cash sitting on the balance sheet.
The Three Core Activities Driving Cash Flow
To make all that movement of money understandable, the cash flow statement breaks everything down into three main buckets. This structure helps anyone, from an investor to a manager, get the full story of a company’s financial health.
-
Operating Activities: This is all about the cash generated from a company's day-to-day business. For a coffee shop, it’s the cash from selling lattes minus the cash paid for beans, milk, and barista salaries. A positive number here is a fantastic sign of a healthy core business.
-
Investing Activities: This section is all about the big moves. It tracks cash used to buy or sell long-term assets—things like purchasing new equipment, selling an old warehouse, or even buying stock in another company. Heavy spending here can indicate a company is betting big on future growth.
-
Financing Activities: This part covers the cash flow between a company and its owners and lenders. This includes taking out a new bank loan, paying back old debt, issuing new stock to raise money, or paying out dividends to shareholders.
The cash flow statement is a powerful diagnostic tool. A company could look profitable on paper but have negative cash flow from its operations, maybe because customers are taking too long to pay their invoices. This is a massive red flag that the other statements might not catch so clearly.
This is precisely why understanding a financial statement, especially this one, is so critical. A business might see a $50,000 profit, but if its cash flow from operations is negative $10,000, it's literally burning through its savings just to keep the lights on. That's an insight you can't afford to miss if you want to survive, let alone grow.
Who Reads Financial Statements and Why It Matters

It’s easy to think of financial statements as just internal bookkeeping, something tucked away in the accounting department. In reality, they're the universal language of business, read by a surprisingly diverse audience, each with high-stakes decisions on the line. These reports aren’t just for accountants; they guide critical actions both inside and outside a company.
For example, investors don’t just glance at these documents—they scrutinize them to decide if a company is a smart place to put their money. They're looking for trends in profit and long-term stability to gauge where the stock might go. On the other side of the coin, lenders and creditors, like your local bank, use these same statements to judge a company's ability to pay back a loan before they extend credit.
But the audience is even broader than that.
Key Users and Their Motivations
A whole host of people depend on the clarity that a solid financial statement provides. Their reasons might differ, but they all need a reliable snapshot of the company’s health.
- Company Management: For executives and department heads, these reports are a strategic roadmap. They use them to set budgets, pinpoint what's working, and spot areas that need immediate attention.
- Employees: Staff members will often check a company's financial health to get a sense of job security or to see if the business is strong enough to support raises and promotions.
- Government Agencies: Think of the IRS. They rely on financial statements to make sure a company is paying its fair share of taxes and complying with the law.
This is exactly why standardized rules like GAAP (Generally Accepted Accounting Principles) are so important. GAAP ensures that the numbers in a report from Apple mean the same thing as the numbers from Google, creating a level playing field for anyone trying to compare them.
This transparency is the bedrock of modern markets. In fact, entire financial systems rely on this data to track risks and maintain stability, a point often backed by analysis from institutions like the World Bank.
Ultimately, getting these documents right is fundamental. Following financial reporting best practices ensures that every user—from an investor to an employee—gets a clear, trustworthy, and actionable picture of a company's performance.
Common Questions About Financial Statements
Now that we’ve walked through the "big three" reports, you probably have a few questions about how all these pieces connect. Let's tackle some of the most common ones to really cement your understanding and build your confidence.
How Do the Three Financial Statements Work Together?
Think of the three statements as a three-legged stool—they aren't separate reports but a single, interconnected system that keeps itself in balance. Each one tells part of the story, but together, they paint the complete picture.
Here’s a great example: The net income you see at the bottom of the income statement doesn't just stay there. That exact number flows into two other key places. First, it gets added to retained earnings in the equity section of the balance sheet. Second, it becomes the starting point for calculating cash flow from operating activities on the cash flow statement.
It's all one big loop. The cash flow statement is designed to explain the change in the cash balance on your balance sheet from one period to the next. The final "net change in cash" on the cash flow statement should perfectly match the difference between your starting and ending cash balances on the balance sheet. This interlocking nature is what makes the whole system so reliable—every number has to tie out.
Can I Trust the Information in a Financial Statement?
When it comes to public companies, the answer is a confident yes. By law, their statements must be audited by independent Certified Public Accountant (CPA) firms. These auditors act as financial detectives, verifying the numbers and making sure the reports follow strict accounting standards like GAAP. That audit report gives everyone a high degree of assurance that what they're reading is accurate.
The real difference between profit and cash flow is one of the most important concepts for any business owner to grasp. Profit is an accounting measure of success (Revenue – Expenses) and can include non-cash items like depreciation. But cash flow is the actual cash moving in and out of your bank account. A business can look profitable on paper but go under if customers don't pay their bills on time. In the end, cash flow is the true test of short-term survival.
Where Can I Find a Company's Financial Statements?
If you're digging into a publicly traded company in the U.S., your go-to resource is the SEC's EDGAR database. Public companies are required to file quarterly reports (Form 10-Q) and annual reports (Form 10-K), which contain their full financial statements. You can usually find these in the "Investor Relations" section of a company's website, too.
Financial statements for private companies, on the other hand, are private. As a business owner, you're in charge of your own financial data. This is exactly why many turn to the 12 best accounting automation tools to make managing it all much easier.
Managing your financial data always starts with clean, organized records. Bank Statement Convert PDF provides powerful software that helps businesses and accountants instantly convert bank statement PDFs into usable Excel spreadsheets. This saves you hours of manual work and ensures your data is ready for analysis from day one. Get started at bankstatementconvertpdf.com.