Before you can even think about building a financial report, you have to get your hands dirty with the raw materials. This first phase is all about gathering every single piece of financial data for the period you're analyzing. I'm talking about bank statements, invoices, receipts, and payroll records—the whole lot. Getting this right from the start is the single best way to avoid major headaches down the line.
Building Your Financial Reporting Foundation
The real work of financial reporting starts long before you open a spreadsheet. Think of this initial stage as gathering all the ingredients for a complex recipe. Your goal isn't just to make a big pile of documents; it's to create a complete, organized dataset that tells the story of every financial transaction that happened. This is what separates a reliable report from a confusing mess of numbers.
Gathering Your Core Financial Documents
The first thing to do is methodically pull together all your source documents. If you have gaps here, your reports will be full of holes and inaccuracies, making them pretty much useless for making smart business decisions.
To make this easier, here’s a quick look at the essential documents you’ll need to kick off the financial reporting process. Think of it as your pre-flight checklist.
Essential Documents for Financial Reporting
| Document Type | Purpose | Where to Find It |
|---|---|---|
| Bank & Credit Card Statements | Provides a complete record of all cash inflows and outflows. The ultimate source of truth. | Your bank's online portal or paper statements. |
| Sales Invoices & Receipts | Verifies all revenue your business earned. Proof of what you've sold. | Your accounting software, CRM, or invoicing system. |
| Vendor Bills & Purchase Receipts | Confirms all your expenses, from office supplies to software subscriptions. | Email inbox, accounting software, or physical files. |
| Payroll Records | Details all wages, taxes, and benefits paid out to your team. | Your payroll provider's dashboard or internal HR records. |
Once you have these documents in hand, you’ve got the foundation you need to start building an accurate financial picture.
Creating a Verifiable Dataset
Just having a stack of papers (or a folder of PDFs) isn't enough. The next step is to make sure they all tie together into a cohesive and verifiable dataset. This is a core bookkeeping principle that stops small errors from turning into massive problems.
For anyone running a small business, our guide on https://bankstatementconvertpdf.com/bookkeeping-basics-for-small-business/ offers a great framework for getting this right. It’s all about turning the initial chaos into a structured format that’s ready for the next step: categorization.
A financial report is only as reliable as the data it's built on. Taking the time to gather and organize every source document isn't just a preliminary step—it's the bedrock of financial integrity.
This whole process of meticulous data gathering has definitely gotten more interesting in recent years. With digital banking on the rise, we're dealing with more sources than ever. Globally, 40% of adults in developing economies now save money in a financial account, a huge jump largely driven by digital financial services. For anyone preparing reports, this means you have to be ready to pull in and reconcile digital transactions from multiple platforms, not just a single bank account.
This foundational work is central to the role of a Financial Controller, who is ultimately responsible for the entire reporting process. Ensuring the integrity of this initial dataset is their top priority because it paves the way for accurate analysis and genuinely useful strategic insights.
Turning Raw Data into Meaningful Categories

Alright, you’ve gathered all your documents and now you're staring at a massive list of transactions. This is where the real work begins—and frankly, where the magic happens. We're about to turn that raw data into a story that reveals the health of your business.
The first, and most crucial, step is categorization. Think of it as sorting every dollar into its proper home. This process is the absolute backbone of any financial statement you'll ever create.
It’s a lot like sorting groceries after a big shopping trip. You wouldn’t just dump everything on the counter and call it a day, right? Of course not. You put the milk in the fridge, the cereal in the pantry, and the cleaning supplies under the sink. Financial categorization is the exact same concept—everything needs a logical, consistent place.
The Core Buckets of Your Business
Every single transaction your business makes will fall into one of just a few main categories. Getting a firm grip on these "buckets" is fundamental if you want to prepare accurate financial reports.
Here are the primary groups you’ll be working with:
- Revenue: This is pretty straightforward. It’s all the money coming in from your main business activities, like selling products or providing services.
- Cost of Goods Sold (COGS): These are the direct costs of what you sell. Think raw materials, direct labor for your production team—anything that goes directly into creating your product.
- Operating Expenses (OpEx): These are the costs of keeping the lights on. It’s everything you spend to run the business that isn't directly tied to a product, like rent, utilities, marketing, and admin salaries.
- Assets: Simply put, this is what your company owns that has value. Cash in the bank, office equipment, and money customers owe you (accounts receivable) all fit here.
- Liabilities: This is what your company owes to others. This includes bank loans, bills you need to pay (accounts payable), and outstanding credit card balances.
Your immediate goal is to assign every single line item from your bank statements to one of these groups. If you're dealing with a high volume of transactions, it might be worth exploring some financial data extraction tools that can help automate a lot of this tedious work.
Consistency Is Your Best Friend
Now for a piece of advice I can't stress enough: consistency is everything. If you classify a transaction one way today, you must classify it the same way next month and next year. Any inconsistency completely destroys your ability to compare performance over time.
For example, let's say you categorize your monthly Zoom subscription under "Software" in January but then list it as "Utilities" in February. Your reports will suddenly show weird spikes and dips in both categories, and you'll have no idea how much you're really spending on software.
Key Takeaway: The best thing you can do for yourself is create a simple "Chart of Accounts." This is just a list of your specific subcategories that acts as your rulebook. It ensures you—and anyone else on your team—categorize transactions the same way, every single time.
Let's walk through a real-world scenario. Imagine you just bought a new laptop for $1,500 and also paid your monthly $50 subscription for your project management software.
- The $1,500 laptop is a one-time purchase of equipment that will provide value for years. That makes it an Asset, not a day-to-day expense.
- The $50 software subscription is a recurring cost required to keep the business running. This is a classic Operating Expense.
Mixing these two up would seriously misrepresent your company's financial standing. But when they're sorted correctly, the data starts to form a clear and accurate picture, which is the entire point of this exercise.
Assembling Your Three Core Financial Statements
Alright, with your transactions all sorted and categorized, it's time to get to the good stuff: building the three core financial statements. Think of these as the pillars of your financial story: the Income Statement, the Balance Sheet, and the Statement of Cash Flows.
Each one paints a different picture, but together they give you a complete, panoramic view of your business's financial health. This is where we turn that neatly organized data into real, actionable intelligence.
This whole process can feel a bit abstract at first, so here’s a great visual that shows how you get from raw bank data to a polished report.
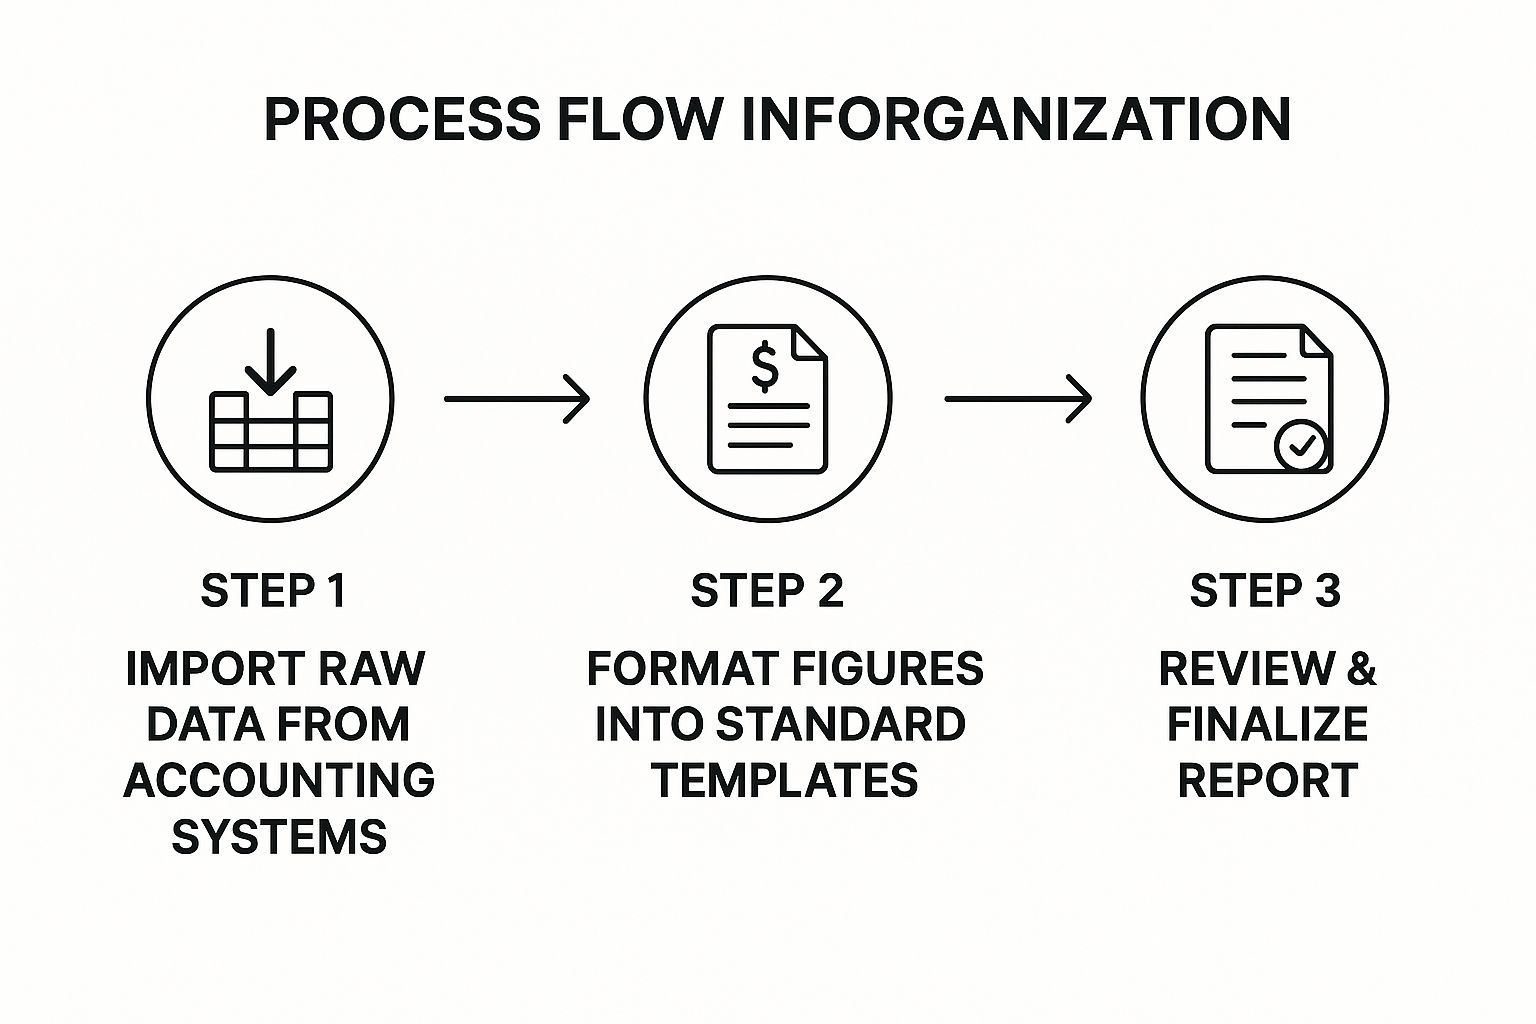
As you can see, it's a logical flow from one stage to the next, which is exactly how we're going to tackle it.
Crafting Your Income Statement
You’ve probably heard this called the Profit and Loss (P&L) statement. Its job is to answer one fundamental question: "Did we make money?" It’s a look at your financial performance over a specific timeframe, whether that's a month, a quarter, or a year.
To build one, you’re basically pitting your revenue against your expenses.
- Add Up All Your Revenue: Tally every dollar your business earned. This is mainly your sales, but don’t forget other income sources, like interest you might have earned on a business savings account.
- Calculate Cost of Goods Sold (COGS): This is the total of all the direct costs tied to creating your product or service.
- Find Your Gross Profit: Simply subtract your COGS from your total revenue. This is a crucial number that shows how efficiently you’re making the things you sell.
- Total Your Operating Expenses: Now, gather up all the other costs of keeping the lights on—things like rent, marketing spend, salaries, and software subscriptions.
- Determine Your Net Income: Subtract those operating expenses (plus any taxes or interest payments) from your gross profit. This is your bottom line, the final figure that tells you if you ended up with a profit or a loss.
Building the Balance Sheet
The Balance Sheet is different. It’s not about a period of time; it’s a snapshot of your company’s financial position on one specific day. It all hinges on a single, unbreakable rule of accounting.
Assets = Liabilities + Equity
This simple equation is the entire foundation of the Balance Sheet. It means that everything the company owns (Assets) has been paid for in one of two ways: by borrowing money (Liabilities) or with funds from owners and investors (Equity).
To put it together, you list out all your assets on one side and all your liabilities and equity on the other. And they absolutely must be equal. If they don’t balance, it's a dead giveaway that a transaction has been miscategorized somewhere along the line. For a deeper look at what goes into each of these categories, our guide on what is a financial statement is a great resource.
Demystifying the Statement of Cash Flows
Here's a common trap: your Income Statement shows a healthy profit, but your bank account is empty. How does that happen? The Statement of Cash Flows tells you exactly why by tracking the actual cash moving in and out of your business.
It breaks everything down into three key activities:
- Operating Activities: Cash that comes from your core business operations—what you do day in and day out.
- Investing Activities: Cash spent on or received from selling long-term assets, like buying a new piece of equipment or selling a company vehicle.
- Financing Activities: Cash that flows between the company and its owners or creditors. Think loans from a bank, investments from shareholders, or even paying off debt.
By separating cash movements this way, you get a crystal-clear picture of your liquidity. It's the ultimate tool for managing your cash and making sure you can pay your bills on time. Keep in mind that external factors play a big role here, too. The global economy has a massive effect on financial reporting. Since the 2008 financial crisis, for instance, investment in OECD countries has been sluggish, and recent high inflation directly affects how you value assets and liabilities. You can read more about these economic trends on OECD.org.
How to Read and Understand Your Financials

You’ve done the hard work of creating your financial reports, which is a massive win. But the real magic happens next. Those numbers on the page aren't just figures; they're telling you a story about where your business has been and where it's headed. Learning to read that story is how you transform a bookkeeping chore into one of your most powerful strategic tools.
This is where we pivot from simply preparing reports to actually interpreting them. We're moving beyond looking at raw data and starting to understand what it all means for your daily operations and your biggest goals.
Unlocking Insights with Financial Ratios
The fastest way to get a handle on your financial health is by looking at ratios. These are simple calculations that put your numbers into context, comparing different figures from your statements to give you a clearer picture. Instead of getting lost in individual dollar amounts, ratios help you measure performance, spot trends, and catch potential issues before they spiral.
Think of them as a quick checkup for your business. They help diagnose your financial strengths and pinpoint any underlying weaknesses. And you don’t need an accounting degree to use them—you just need to know which numbers to compare.
Here are three of the most important ratios you can calculate right now using the statements you just built:
-
Current Ratio (Liquidity): This tells you if you have enough cash on hand to cover your immediate bills. To find it, divide your Current Assets by your Current Liabilities. A ratio above 1 is a good sign, meaning you have more short-term assets than short-term debts.
-
Debt-to-Equity Ratio (Leverage): This one shows how much of your business is financed through debt versus the money you've personally invested. Calculate it by dividing your Total Liabilities by your Shareholders' Equity. A high number might suggest you're relying too heavily on loans.
-
Net Profit Margin (Profitability): This reveals exactly how much profit you’re making from each dollar of revenue. Just divide your Net Income by your Total Revenue, and then multiply by 100 to get a percentage. For example, a 15% net profit margin means you get to keep 15 cents of every dollar you earn.
To make this easier, here’s a quick-reference table that breaks down these ratios and a few others you might find useful.
Key Financial Ratios and Their Meanings
| Ratio Name | Formula | What It Tells You |
|---|---|---|
| Current Ratio | Current Assets / Current Liabilities | Your ability to cover short-term debts. A healthy ratio is typically above 1. |
| Debt-to-Equity Ratio | Total Liabilities / Shareholders' Equity | How much debt you're using to finance your assets versus equity. |
| Net Profit Margin | (Net Income / Total Revenue) * 100 | The percentage of revenue left after all expenses have been paid. |
| Gross Profit Margin | (Gross Profit / Total Revenue) * 100 | The profitability of your core products/services before overhead costs. |
| Return on Equity (ROE) | (Net Income / Shareholders' Equity) * 100 | How effectively you're using shareholder investments to generate profit. |
These formulas are just the starting point. They give you the hard data, but it's your job to connect the dots and understand the story they're telling about your business.
Going Beyond the Formulas
Knowing the formulas is one thing, but applying that knowledge is where the real value lies. Imagine your income statement shows a healthy $20,000 profit. That sounds great on its own, right? But if your cash flow statement for the same period shows you’re actually $5,000 in the red, you've uncovered a serious issue.
This is a classic scenario: a business that's profitable on paper but is running out of actual cash to pay its bills and employees. This is the kind of critical insight that leads to smarter decisions. Maybe you need to tighten up your invoicing process to get paid faster, or perhaps it's time to renegotiate payment terms with your suppliers. The ratios give you the hard evidence to back up those moves.
The goal isn't just to calculate ratios; it's to ask "why?" Why is our profit margin shrinking this quarter? Why is our debt ratio climbing? The answers to those questions are where your best business strategies are born.
As technology advances, so do the tools for interpreting this data. To get an edge, you might want to explore how new tools are changing the game with AI-Powered Business Intelligence. These systems can often spot trends and anomalies much faster than manual analysis, helping turn your historical reports into a predictive roadmap for the future.
Polishing the Final Report for Your Audience

You’ve done the heavy lifting and your core financial statements are built. Now comes the final, crucial step: polishing them for the people who will actually read them. This is where you transform a spreadsheet full of numbers into a professional document that speaks clearly to investors, lenders, or your own leadership team.
Think of it this way: a raw income statement might show a sudden dip in profit, but it doesn't explain why. That's where footnotes and disclosures come in. They provide the story behind the data, explaining one-off expenses, changes in accounting methods, or other significant events that shaped the results.
Adding Context and Nailing the Final Checks
Before you even think about sending that report out, a final, meticulous cross-check is absolutely essential. This is the quality control step that ensures every number ties out and your reports are consistent and accurate. It’s what separates a decent draft from a truly trustworthy financial document.
Here's what I always focus on during this last review:
- Tie the Statements Together: The net income from your Income Statement must match the change in retained earnings on your Balance Sheet. No exceptions.
- Reconcile Your Cash: The ending cash balance on the Statement of Cash Flows has to equal the cash figure on your Balance Sheet. If it doesn't, something's wrong.
- Write Clear, Explanatory Notes: Use footnotes to shed light on any large or unusual transactions. Did you buy a major piece of equipment? Take out a new loan? Explain it.
Running through these checks gives everyone—including you—confidence in the numbers. For a deeper dive into maintaining these standards, our guide to financial reporting best practices is a great resource. And when you're getting ready for tax season, understanding the latest ITR forms can be a real lifesaver.
The numbers tell you what happened; the footnotes tell you why. That context is what turns a simple financial statement into a powerful communication tool.
It's also worth noting that today's stakeholders expect more than just the financials. There’s a huge push for transparency around non-financial metrics, especially Environmental, Social, and Governance (ESG) factors.
We're seeing a massive shift toward sustainability reporting. For instance, the EU's Corporate Sustainability Reporting Directive (CSRD) now mandates climate risk disclosures for more companies, and over 20 countries are adopting new international standards to integrate these metrics. Including this kind of context shows you're not just looking at the balance sheet, but at the bigger picture.
Common Questions About Financial Reporting
https://www.youtube.com/embed/p5pflBBopN8
Even with a solid process in place, some practical questions always seem to come up when it's time to build financial reports. Let's walk through a few of the most common hurdles I see business owners run into. Getting these answers straight can help you move forward with a lot more confidence.
How Often Should I Prepare Reports?
For your own internal use—making smart decisions and steering the ship—you really want to be looking at your numbers monthly. This is the gold standard. It gives you a tight grip on your performance and cash flow, letting you spot trends and fix problems before they get out of hand.
When it comes to outside needs, like for the tax man or a bank loan, you’ll typically be asked for quarterly or annual reports. The beauty of getting into a monthly rhythm is that when these bigger reporting deadlines pop up, you’re not scrambling. The data is already there, making the whole process much smoother.
The Real Difference Between Profit and Cash
This is a big one. It trips up new and even seasoned entrepreneurs all the time.
Think of it this way: your income statement (or P&L) tells you if you're profitable. It matches revenues you've earned with the expenses you've incurred in a specific period, regardless of when the cash actually moved.
Your cash flow statement, however, is all about the cash. It's a literal, nuts-and-bolts record of every dollar that came into and went out of your bank account.
It's entirely possible to have a beautiful, profitable income statement but be completely out of cash. This happens all the time. That’s exactly why you need both reports. One tells you about profitability, the other tells you about your ability to pay the bills. Together, they paint the full picture.
Can I Do This Myself, or Do I Need an Accountant?
You can absolutely handle your own basic financial reports, especially when you're just starting out or have a pretty straightforward business model. With good accounting software and a firm grasp of the basics, you can get surprisingly far on your own.
But as your business grows, things get more complicated. That's when bringing in a professional accountant or bookkeeper becomes a game-changer. It’s not just about accuracy and compliance; a good pro offers strategic advice on taxes and financial planning that can save you a ton of time and prevent very costly mistakes down the line.
At Bank Statement Convert PDF, we take the pain out of that first, critical step: getting usable data from your bank statements. We turn those messy PDFs into clean, organized Excel files you can actually work with.
To streamline your data collection and get a running start on your next report, check out our tools at Bank Statement Convert PDF.