
If you've ever felt limited by the basic transaction lists your bank provides, you're not alone. Building your own bank account statement format in Excel is about taking back control and making your financial data actually work for you, moving beyond a simple record of what's already happened.
Go Beyond Basic Bank Downloads with a Custom Excel Statement

Think of the standard CSV or PDF download from your bank as a static snapshot. It tells you what happened, but it offers zero context. A custom Excel template, on the other hand, is a living, breathing document that you build to track what truly matters to you.
Let’s look at a couple of practical examples of how this plays out:
- For Freelancers: Imagine adding a 'Project' or 'Client' column to your transaction log. Suddenly, you can instantly see which projects are most profitable and simplify your invoicing process without tedious manual sorting.
- For Families: You could create custom spending categories like 'Groceries,' 'Utilities,' or 'Kids' Activities.' This helps you spot spending leaks and see exactly where your money is going in a way a generic bank statement never could.
This hands-on approach is how you turn raw data into real financial intelligence. The initial setup pays for itself many times over in clarity and control. Understanding this is a core part of knowing how effective bookkeeping can benefit your business.
Key Takeaway: The goal isn't just to copy what your bank gives you. It's about enriching that data with custom tags—like project codes, budget categories, or tax-deductible flags—that make your financial information genuinely useful for making decisions.
Of course, the first hurdle is often just getting your data into a usable format. If you're starting with a PDF, our guide on how to convert a bank statement to Excel can help you get started: https://bankstatementconvertpdf.com/how-to-convert-bank-statement-to-excel/
It's also worth noting that technology is making this even easier. Modern tools can now link Excel directly to thousands of banks, which can cut down your data prep time by as much as 70%.
Building Your Excel Bank Statement From Scratch
When you decide to build your own bank account statement format in Excel, the most important thing is to get the foundation right. It’s easy to get bogged down in fancy designs, but the real power lies in a few essential columns that capture every transaction detail. This simple structure is where all your future financial tracking and analysis begins.
First things first: open a new Excel workbook. In the very first row, you're going to create the headers for your core columns. For any useful statement, these are the non-negotiables: Date, Description, Category, Debit, Credit, and Running Balance. Think of them as the building blocks for a clear, comprehensive view of your finances.
Taking a minute to format these columns correctly now will save you from a world of frustration later. It’s all about making sure your data is clean and ready for formulas.
- For Dates: Just select the entire 'Date' column and format it as 'Short Date' (like MM/DD/YYYY). This keeps everything consistent.
- For Currency: Highlight the 'Debit,' 'Credit,' and 'Running Balance' columns, then format them as 'Currency.' This automatically adds the dollar sign (or your local symbol) and the correct decimal places.
This quick infographic gives a nice visual overview of the initial setup.
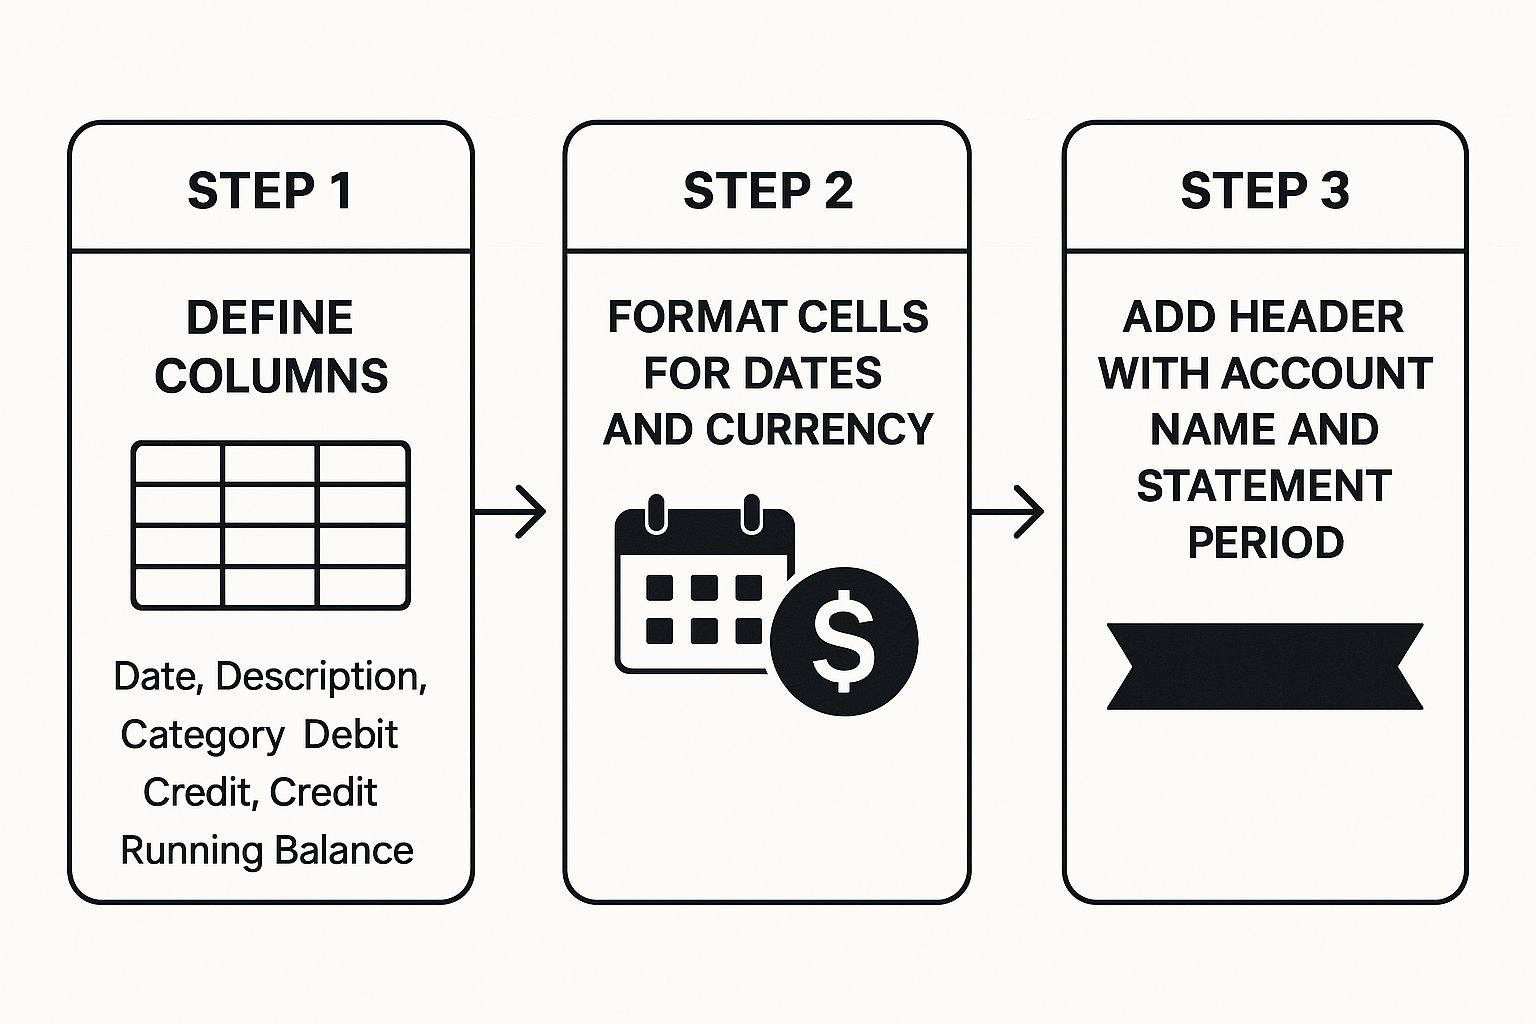
As you can see, it really boils down to three key pillars: defining your columns, formatting the cells, and adding a simple, professional header.
Defining Your Columns
Each column tells a part of your financial story. The 'Category' column, for example, is your secret weapon. This is where you add your own context—something a standard bank download never gives you. You can tag a transaction as "Groceries," "Client Project A," or "Utilities," which makes sorting and analyzing your spending incredibly powerful.
To help you get started, here’s a quick guide to the essential columns you'll want in your Excel bank statement.
Key Columns for Your Excel Bank Statement
A quick guide to the essential columns needed to build a functional and organized bank statement template in Excel.
| Column Name | Best Format | Purpose and Real-World Example |
|---|---|---|
| Date | Short Date | This tracks when a transaction happened, which is crucial for sorting your statement chronologically. |
| Description | General | This is where you copy the raw transaction details from your bank, like "AMAZON.COM" or "SHELL OIL." |
| Category | General | Your custom tag for analysis. For example, "Household Supplies" or "Business Software Subscription." |
| Debit | Currency | This column is for money leaving your account, like when you pay a bill or buy something. |
| Credit | Currency | And this one is for money coming into your account, such as your salary or a client payment. |
| Running Balance | Currency | Shows your account balance after each and every transaction. We'll automate this with a formula later. |
Having these columns set up properly from the get-go makes everything that follows much, much easier.
Adding a Professional Header
To finish off the basic setup, let's add a clean header. Just reserve the first few rows above your columns for some key details: the Account Name (e.g., "Business Checking Account"), Account Number, and the Statement Period (e.g., "October 1 – October 31, 2024"). This small touch makes your statement look professional and easy to identify at a glance.
By focusing on these fundamentals first, you create a clean, scalable structure that you can build on. If you're short on time, you can always grab a pre-built Excel bank statement template that already has these best practices baked in. With your columns and header now in place, you're all set to bring this template to life with formulas.
Bringing Your Statement to Life with Excel Formulas
With your columns and headers neatly set up, it's time for the fun part. This is where we turn a static grid of numbers into a living, breathing financial tool using a few key formulas. This step is what will save you from the soul-crushing task of manual calculations.
The absolute cornerstone of any good statement template is the running balance. It’s the formula that keeps a live tally of your account total after every single transaction. Getting this right is what makes the whole thing work, showing you the immediate financial impact of each deposit and withdrawal.
Nailing the Running Balance Calculation
Let's get practical. Imagine your transaction data starts on row 2, right below the headers. Your running balance will likely be in the last column—we'll use column F for this example.
First, you need a starting point. Manually enter your opening balance into a cell above your transactions, perhaps in cell E1. Now, in the first cell of your running balance column (F2), you’ll write your first formula. It simply takes the opening balance, adds the first credit, and subtracts the first debit.
Assuming credits are in column D and debits are in column C, the formula in cell F2 would look like this: =E1+D2-C2
Simple enough. But for the next transaction in row 3, the formula needs to be a bit different. Instead of looking at the opening balance, it needs to look at the previous running balance in cell F2. So, the formula in F3 becomes: =F2+D3-C3
Here's the best part. Once that second formula is in, you don't have to type it again. Just grab the small square at the bottom-right corner of the F3 cell—that's the fill handle—and drag it down as far as you need. Excel automatically adjusts the cell references for every single row. Magic.
Getting a Quick Overview with SUM and SUMIF
Now that your line-by-line balance is sorted, let's add some summary totals to give you a bird's-eye view of your finances. You can place these at the top or bottom of your sheet.
Using the basic SUM function, you can quickly see your total cash flow:
- Total Deposits:
=SUM(D:D) - Total Withdrawals:
=SUM(C:C)
This gives you the big picture, but the real power comes from digging into your spending categories. This is where the SUMIF function shines. It lets you add up numbers only if they meet a certain condition—like matching a specific category.
For instance, if you wanted to see exactly how much you spent on "Groceries" (and your categories are in column B), you'd use this formula: =SUMIF(B:B, "Groceries", C:C)
This single function is a budgeting game-changer. It automatically scans your entire statement, finds every transaction you've tagged as "Groceries," and spits out a total. No more filtering, sorting, or manually adding things up.
These built-in formulas are the heart of an automated statement, drastically cutting down on manual errors and giving you far more accurate financial records. Of course, good formulas depend on good data. To make this process even smoother, you can learn more about how to automate data entry and spend less time typing and more time analyzing.
Adding Visuals for At-a-Glance Financial Insights

A well-structured bank account statement format in Excel is a great start, but let's be honest—staring at rows of numbers can be draining. The real magic happens when you turn that raw data into visuals. Charts and colors tell you the story of your finances in a single glance, transforming a simple spreadsheet into a powerful personal finance dashboard.
One of the quickest wins here is using Conditional Formatting. This fantastic tool automatically changes a cell's color or style based on rules you create. Think of it as an automated highlighter that draws your eye to what matters most, saving you from having to hunt for it yourself.
Highlighting Key Transactions
Let's put this into practice. Say you want to keep an eye on any significant expenses—anything over $150. You can set up a rule to make those transactions impossible to miss.
It's surprisingly easy to do:
- First, select the entire column where your debits are listed.
- Head over to the Home tab and find Conditional Formatting.
- From there, choose Highlight Cells Rules > Greater Than….
- A small window will pop up. Just type 150 into the box and pick a format, like the classic "Light Red Fill with Dark Red Text."
Just like that, every large withdrawal will practically jump off the page. You could do the same for your categories—maybe coloring all "Groceries" transactions green to see just how often you're at the supermarket.
A great visual statement answers your most pressing financial questions instantly. You shouldn't have to dig to find out things like, "What's my biggest spending category?" or "Is my balance trending up or down?" The answers should be obvious in seconds.
Creating Simple Financial Charts
When you want to see the bigger picture, nothing beats a good old-fashioned chart. Now that your data is neatly categorized, you can whip up some incredibly insightful visuals in just a couple of clicks.
For a bank statement, two charts are particularly useful:
- Pie Chart: This is your best friend for understanding where your money is going. Just select your 'Category' and 'Debit' columns, and Excel will create a visual breakdown of your spending habits. It's perfect for a monthly review.
- Line Graph: Want to see how your balance changed over time? A line graph is the tool for the job. Select your 'Date' and 'Running Balance' columns to create a simple graph that maps out your financial ups and downs throughout the month.
Keeping Your Bank Statement Template Up-to-Date
So, you've built your bank account statement format in Excel. That's a great start, but the real power of this tool comes from keeping it current. A template is only as useful as the data inside it, so let's walk through how to add new transactions without messing everything up.
The easiest method by far is to download a CSV file of your recent activity directly from your online banking portal. Most banks offer this feature.
Once you have the file, just open it, copy the new transaction rows, and paste them at the very bottom of your master template. Pay close attention to the columns—make sure the date, description, and amounts from the bank's file line up perfectly with the columns you created.
How to Keep Your Data Clean and Accurate
Bank downloads aren't always perfect. You'll often find that the raw data needs a bit of tidying up. Sometimes the date formats are funky, or there's extra, unnecessary text cluttering up the description column. Taking a minute to standardize this information is crucial for making sure your formulas and charts work as intended.
One of the most common mistakes I see is people inserting new rows in the middle of their statement. This will almost certainly break your running balance formula. Always, always add new data to the end.
If you need to make a correction for a transaction from earlier in the month, it's much safer to edit the existing line item directly rather than trying to insert a new row. For a deeper dive into this, our guide on how to do bank reconciliation in Excel has you covered: https://bankstatementconvertpdf.com/how-to-do-bank-reconciliation-in-excel/
Pro Tip: I like to create a separate tab for each month (e.g., "Jan 2024," "Feb 2024"). This keeps the workbook tidy and prevents any single sheet from becoming painfully slow. By the end of the year, you'll have a perfect, month-by-month financial record ready for review.
Navigating Common Issues with Your Excel Statement
Even with a perfect template, you're bound to run into a few snags along the way. It happens to everyone. Let's walk through some of the most common questions and how to troubleshoot them.
What's the Easiest Way to Fix a Broken Running Balance?
This is, by far, the most frequent headache. You delete a row, and suddenly your whole balance column is a mess of #REF! errors. Don't panic; the fix is usually quick.
Just find the last cell in your balance column that still shows the correct amount. Click on the cell directly below it and re-type the formula. For example, if your last good balance is in cell F5, your new formula in F6 would be something like =F5 + E6 - D6.
Once that’s entered, grab the fill handle—that tiny square in the bottom-right corner of the cell—and drag it all the way down to your last transaction. Excel will automatically adjust the formula for every single row, and your balance will be back in business.
Can I Actually Use This for My Taxes?
You bet. A well-organized Excel statement can be a lifesaver come tax season. If you’ve been diligent about categorizing your income and expenses, you can easily use functions like SUMIF to get totals for all your deductible categories. Need to know your total spend on "Office Supplies" for the year? A simple formula can pull that for you in seconds.
Just remember, while this spreadsheet is fantastic for getting your numbers organized, it's not a replacement for official records. Always hang on to the original bank documents and receipts, as those are what the IRS will want to see.
A lot of people also wonder how these organized statements are used in the real world. They are crucial for things like applying for certain financial products, such as bank statement loans for the self-employed, where lenders need to see a clear financial picture.
Transform your financial documents with Bank Statement Convert PDF. Our software effortlessly converts bank statement PDFs into organized Excel spreadsheets, saving you time and eliminating manual data entry. Get started today!