Think of financial statements as a company's financial storybook. Each report is a different chapter, telling you a crucial part of the story about its health, performance, and where it's headed. They're not just for accountants; they're the language of business.
Your Quick Guide to Financial Statements

Learning to read these documents is a game-changer for anyone—from investors trying to spot the next big thing to entrepreneurs trying to keep their business on track. They provide the hard numbers you need to make smart, informed decisions.
Let's break down the big three with a simple road trip analogy to make sense of it all. Imagine your business is a car on a long journey. Each financial statement answers a different, critical question about that trip.
- The Balance Sheet is like a snapshot. It's your GPS showing your exact financial position at a single point in time—what you own, what you owe, and what’s left over.
- The Income Statement is the trip log. It tells the story of your journey over a period (like a quarter or a year), showing the revenue you earned (miles traveled) and the expenses you incurred (gas burned) to see if you ended up profitable.
- The Cash Flow Statement is your fuel gauge. It tracks the actual cash coming in and going out, making sure you have enough gas in the tank to keep the engine running and reach your destination.
These statements became standardized in the early 20th century, a time when massive industrial companies were growing and investors demanded a clearer look under the hood. Today, we generally focus on four key reports: the balance sheet, income statement, cash flow statement, and the statement of changes in equity. You can dive deeper into their evolution by exploring materials like the International Monetary Fund's global stability reports.
By learning to read each one, you can put together a complete, multi-dimensional picture of a company’s financial reality.
The Three Core Financial Statements at a Glance
To make this even clearer, here's a quick cheat sheet that breaks down the purpose and timeframe of the three primary statements.
| Statement | What It Shows | Time Frame |
|---|---|---|
| Balance Sheet | A snapshot of what a company owns and owes. | A specific point in time (e.g., "as of December 31, 2023"). |
| Income Statement | A summary of revenues and expenses to show profitability. | A period of time (e.g., "for the year ended December 31, 2023"). |
| Cash Flow Statement | A record of all cash moving in and out of the business. | A period of time (e.g., "for the year ended December 31, 2023"). |
This table helps you quickly remember which statement to look at depending on the question you're trying to answer about a business.
The Balance Sheet: What a Company Owns and Owes

If you want to understand a company's financial health at a single point in time, the balance sheet is where you look. It’s not a story of performance over a month or a year; it’s a detailed financial photograph taken on one specific day.
Everything on a balance sheet is governed by one, non-negotiable rule: the fundamental accounting equation.
Assets = Liabilities + Equity
This isn't just a formula—it's the core principle that ensures the books are, well, balanced.
To bring this concept home, think about your personal finances. Your house, car, and savings are your assets. The mortgage on your house and the loan on your car are your liabilities—what you owe. Whatever is left over after you've paid off those debts is your equity. A company’s balance sheet operates on the very same logic.
Breaking Down the Balance Sheet Equation
Each piece of that equation tells a critical part of a company's financial story. Getting a handle on these components is the first step to really understanding what a balance sheet is telling you.
-
Assets: These are all the resources the company owns that have future economic value. Think of things like cash in the bank, the inventory of products ready to be sold, the factory equipment used to make those products, and the money customers still owe you (this is called accounts receivable).
-
Liabilities: This side of the coin represents everything the company owes to others. It includes debts like money owed to suppliers (accounts payable), unpaid employee salaries, and long-term bank loans.
-
Equity: Often called shareholders' equity or owner's equity, this is what’s left over. It’s the residual value that would belong to the owners if the company were to sell off all its assets and pay off every single one of its liabilities.
The balance sheet is constructed by pulling together the final balances of every account a business holds. These figures are first organized and checked for accuracy in a different report, which you can explore in our guide on how to prepare a trial balance. Getting that step right is absolutely essential for creating a reliable balance sheet.
The Income Statement: Tracking Profitability Over Time

If the balance sheet is a snapshot in time, think of the income statement as the highlight reel of a company's financial performance. Often called the Profit and Loss (P&L) statement, its job is simple: to show you whether the business made or lost money over a specific period, like a quarter or a year.
The P&L tells a story, starting from the very top. It begins with revenue (or sales), which is all the money a company brought in from selling its products or services. This is famously known as the "top line" because it's the first number you'll see. From that point on, it’s all about subtraction.
Think of it like a local coffee shop. Its revenue is the total cash from every latte, muffin, and sandwich sold.
The Journey to the Bottom Line
To figure out if the coffee shop is actually profitable, we have to start chipping away at that revenue figure by deducting all the costs of doing business. This process happens in a few key stages, each revealing a different layer of profitability.
-
Cost of Goods Sold (COGS): These are the direct costs tied to making what you sell. For our coffee shop, that’s the coffee beans, milk, sugar, and flour. Subtracting COGS from revenue gives you the gross profit.
-
Operating Expenses: Next come the costs of keeping the lights on—things not directly baked into a single product. This includes the baristas' wages, the shop's rent, and the marketing budget.
Once you subtract these operating costs, you get the operating income. This is a crucial number because it tells you how profitable the company's core business is, before accounting for things like interest payments and taxes.
After all those expenses are paid, what's left over is the net income. This is the famous "bottom line," and it gives you the final, definitive answer to the question: Was the business profitable?
Learning to read an income statement is a foundational skill. By looking at P&Ls over several periods, you can see if a company’s profits are growing, stalling, or shrinking. For those ready to go a step further, various financial statement analysis techniques can help you spot trends and uncover deeper insights hidden in the numbers.
The Cash Flow Statement: Following the Money
Profit on an income statement can look great on paper, but it doesn't always mean a company actually has cash in the bank. This is where the statement of cash flows comes in—it’s the ultimate reality check. It tracks the real money moving in and out of a business, showing you its true liquidity and, frankly, its ability to survive.
Think of it like your personal checking account. Your paycheck is your income, but your actual cash balance only changes when money is deposited or withdrawn. This statement follows that exact principle for a business, showing how it generates and uses cash across three core areas.
The Three Core Cash Flow Activities
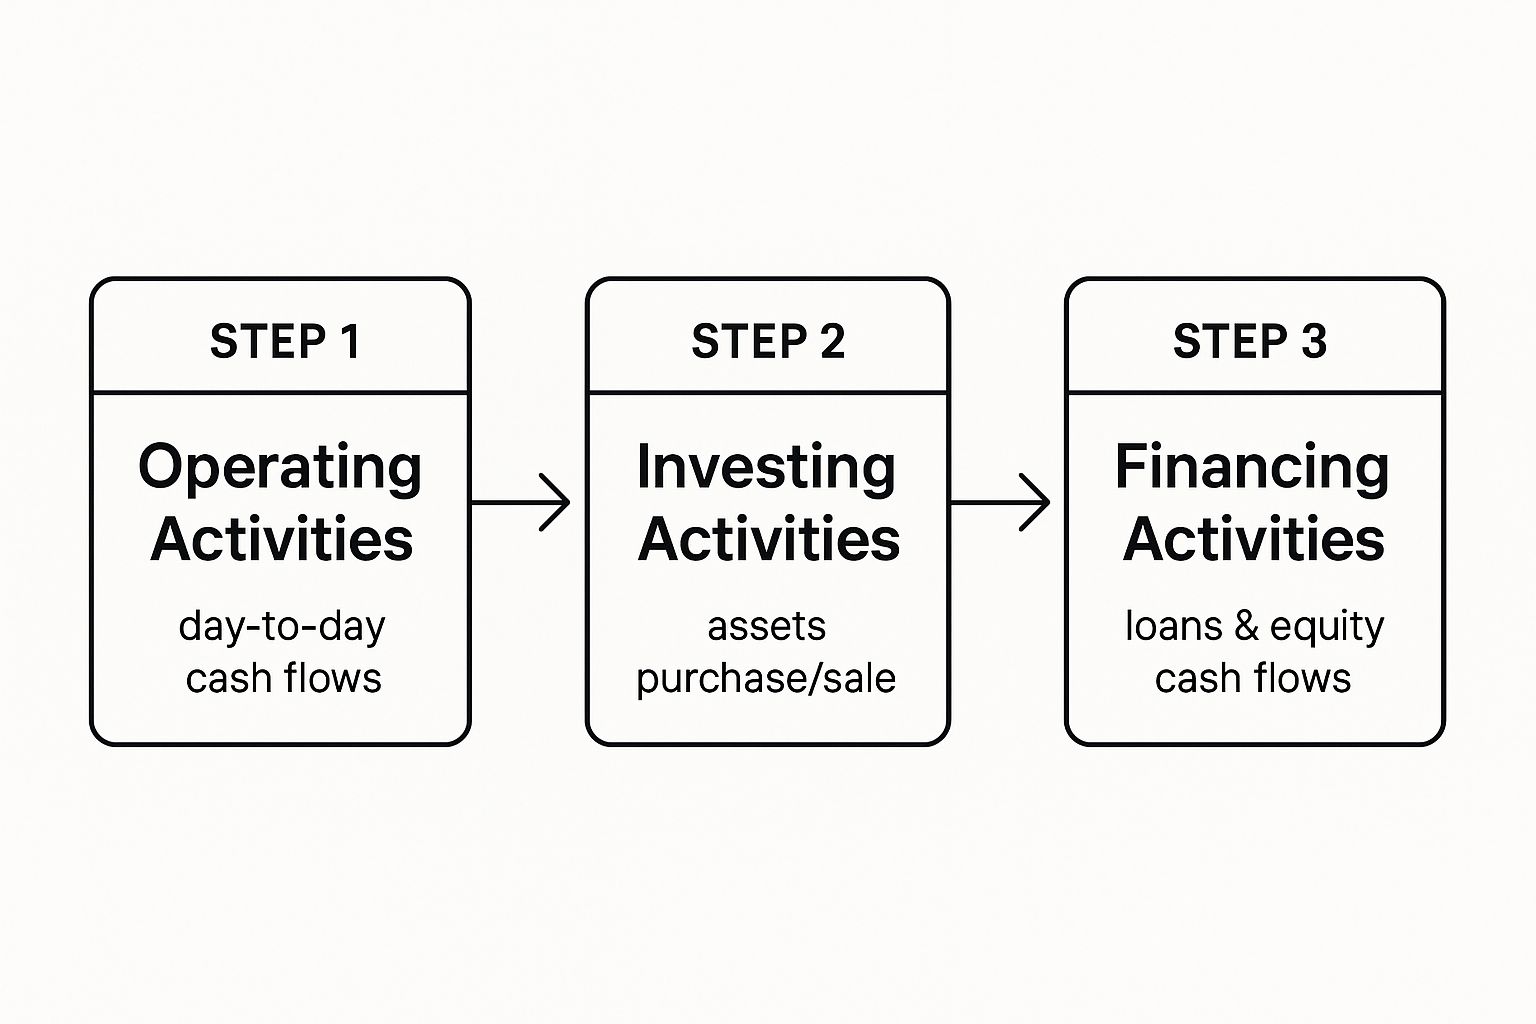
To really get a feel for a company's financial health, you have to see where its cash is coming from and where it's going. The cash flow statement neatly organizes this movement into three distinct categories.
-
Operating Activities: This is all about the cash generated from a company's main, day-to-day business. For a coffee shop, it’s the cash from selling lattes minus the cash paid for beans, milk, and employee wages. A healthy business should consistently generate positive cash flow from its operations.
-
Investing Activities: This section tracks cash used to buy long-term assets or cash received from selling them. Think of it as the company's investment in its future—things like buying new machinery, purchasing another company, or selling an old property.
-
Financing Activities: This details the cash flow between a company and its owners (shareholders) and lenders. It includes money raised from issuing stock, cash paid out as dividends, or funds from taking out—and paying back—bank loans.
This infographic breaks down how these three activities work together to tell the complete cash story.
By looking at the cash flow from each category, you can quickly tell if a business is funding itself through its core operations or if it's leaning heavily on debt to stay afloat. For a deeper dive, our guide on understanding cash flow statements has you covered.
The sum of the cash flows from these three activities explains the change in a company’s cash balance from the beginning to the end of a period. This final number connects directly back to the cash line item on the balance sheet.
The importance of these reports is massive on a global scale. In fiscal year 2024, the market capitalization of companies relying on these statements topped $120 trillion, with the U.S. alone making up about $50 trillion of that. Clear, honest financial reporting isn't just good practice; it's the foundation of market stability and investor trust. You can discover more insights on global financial data from the World Bank.
How the Three Statements Work Together
It’s a common mistake to look at financial statements as separate, standalone documents. In reality, they're a deeply interconnected system. Think of them like three different camera angles filming the same event—each gives you a unique perspective, but you need all three to understand the complete story of a company’s financial life.
This whole relationship is built on a few critical connections that tie the reports together, creating a seamless financial narrative. The process always kicks off with the income statement’s final number.
The net income—that famous "bottom line"—doesn't just sit there. It flows directly into the balance sheet and gets added to the company’s retained earnings, which is a key part of shareholders' equity. This makes perfect sense when you think about it: the profit a company earns and doesn't pay out as dividends rightfully belongs to its owners.
Tracing the Flow of Information
That first link is just the starting point. The cash flow statement then acts as a crucial bridge, connecting the profit from the income statement to the actual cash sitting on the balance sheet. It essentially reconciles the two.
- The cash flow statement begins with net income.
- It then adjusts for any non-cash expenses, like depreciation, that were on the income statement but didn't actually involve cash leaving the bank.
- Finally, it accounts for cash used in investing (like buying equipment) and financing (like taking out a loan).
The final number, the net change in cash, explains exactly why the cash balance on the balance sheet changed from the beginning of the period to the end.
By linking net income to equity and then reconciling all of that with the final cash balance, these three statements create a self-checking loop. If one report has an error, it will immediately cause a mismatch in the others, forcing you to find and fix the issue.
Let's say a company buys a new delivery truck. This one transaction ripples across all three statements. It shows up as a cash outflow under investing activities on the cash flow statement. On the balance sheet, it increases one asset (equipment) while decreasing another (cash).
Understanding how these pieces connect is what separates basic bookkeeping from true financial analysis. For those ready to build these reports from scratch, our guide on compiling a financial statement in Excel is a great next step.
Frequently Asked Questions About Financial Statements
Now that we've covered the big three statements, let's dig into some of the questions that pop up most often. Getting these answers down will help you connect the dots between the theory and how this all plays out in the real world.
Who Actually Uses Financial Statements and Why?
You might be surprised by just how many different people rely on these reports. Think of them as the universal language of business, essential for making some pretty important decisions.
- Investors & Shareholders: These are the folks putting their money on the line. They pour over financial statements to gauge a company's health and decide whether to buy, sell, or hold stock. A history of strong profits and healthy cash flow is exactly what they're looking for.
- Lenders & Creditors: Anyone from a big bank to a small supplier wants to know if they'll get paid back. They analyze these documents to judge a company's creditworthiness before they'll issue a loan or extend payment terms.
- Company Management: For the people running the show, these statements are like a dashboard for the business. They use them to make smart strategic calls, set realistic budgets, and see if they're actually hitting their targets.
Even government bodies and tax authorities get in on the action, using these reports to ensure everyone is playing by the rules.
What Is the Difference Between GAAP and IFRS?
Think of GAAP (Generally Accepted Accounting Principles) and IFRS (International Financial Reporting Standards) as two different dialects of the same accounting language. They’re both comprehensive rulebooks designed to make sure financial reporting is consistent, transparent, and trustworthy.
The biggest difference is geography. GAAP is the standard used almost exclusively in the United States, while IFRS is the go-to in over 140 other countries, including the European Union and Canada. While they aim for the same outcome, they have slightly different rules for things like how you value inventory or account for development costs.
How Often Are Financial Statements Released?
This really depends on whether a company is public or private. Publicly traded companies are on a much tighter leash because they have a responsibility to keep their investors in the loop.
They are typically required to release financial statements quarterly in a report called a 10-Q, and annually in a much more detailed 10-K report. That annual report is always audited by an independent accounting firm to verify its accuracy.
Private companies have a lot more wiggle room. They aren't legally required to share their financials with the public, but they still prepare them regularly for their own leadership teams, bankers, and any private investors they might have.
Can Financial Statements Be Misleading?
In a word, yes. While standards like GAAP and IFRS are there to keep things honest, some companies can get a little too creative. They might use legal accounting loopholes to paint a rosier picture of their performance than what's really going on.
Worse, there are cases of outright fraud. This is exactly why you can't just look at one statement in isolation. A company might post a massive net income on its P&L, which looks fantastic. But if the cash flow statement shows it's actually hemorrhaging cash, that’s a huge red flag. Looking at the complete picture is your best defense against being misled. While this guide focuses on financial statements, you can visit our main FAQ page for answers to other common questions.
At Bank Statement Convert PDF, we build tools to help you make sense of your financial data quickly and accurately. Our software is designed to help you transform complex bank statement PDFs into easy-to-use Excel files, saving you time and preventing costly errors.
Ready to simplify your financial analysis? Get started with our converter today!