For freelancers and small business owners, a simple spreadsheet can be one of the most powerful, low-cost tools in your financial toolkit. It's the perfect way to keep a close eye on your spending, get a handle on cash flow, and make tax season a whole lot less stressful. The real beauty of it is the total control—you can set it up to track expenses in a way that makes perfect sense for your specific business.
Why a Spreadsheet Is Still Your Best Financial Friend

Before you jump into a complicated software subscription, let's talk about the elegant power of a simple spreadsheet. For so many of us—freelancers, startups, and small businesses—a well-organized sheet isn't just a starting point. It’s often the best long-term solution for managing finances. It really boils down to three things: control, customization, and cost.
Think of a spreadsheet as a blank canvas, unlike rigid accounting software. You get to decide exactly what information matters. For example, a freelance graphic designer I know adds a "Project Code" column. This lets her tag software subscription costs directly to specific client work, which means she can see a project's profitability in an instant. Or imagine a small e-commerce shop tracking shipping supplies—they can pinpoint exactly when those costs start to creep up.
When you have that level of detail, your expense log stops being a chore and turns into a command center for your business finances. It's all about making smarter, data-driven decisions on the fly.
The Go-To Choice for Small Operations
For a lot of small business owners, the choice is pretty clear. Over 60% of them globally still lean on spreadsheets as their primary tool for expense tracking. A huge part of that is the zero-cost entry point. Dedicated software can easily run you $10 to $60 per user every single month, and that adds up.
But it’s not just about saving money. A massive 78% of business owners said their spreadsheets made them feel audit-ready and took a huge amount of stress out of tax season.
The real value of an expense tracking spreadsheet is its simplicity. It makes you get your hands dirty with the numbers, giving you a gut-level understanding of your cash flow that automated systems can sometimes hide.
Building Confidence Through Financial Clarity
At the end of the day, the goal is to stop worrying about money and start feeling confident. A clear, personalized spreadsheet gives you an immediate, real-time snapshot of your business's health. There are no confusing menus or complicated reports to generate—it's just your data, organized exactly how you want it.
This hands-on approach gives you some serious practical advantages:
- Total Customization: You can create categories that actually reflect what you do. Maybe that’s "Client Entertainment" for a consultant or "Raw Materials" for an artisan.
- No Steep Learning Curve: Most people already have a basic feel for spreadsheets, so you can skip the hours of training videos.
- You Own Your Data: Your financial information stays with you, on your computer or cloud drive. It’s not locked into a third-party subscription you have to keep paying for.
Ready to build your own? This guide on https://bankstatementconvertpdf.com/how-to-track-business-expenses/ is a fantastic place to start.
Building Your Expense Tracker From Scratch
Staring at a blank spreadsheet can feel a little daunting, I get it. But this is your chance to build the perfect financial tracking system for your business from the ground up. Whether you're in Excel or Google Sheets, the goal is the same: create a simple, logical structure that tells you everything you need to know without getting bogged down in unnecessary details.
Before you even type your first header, it's worth taking a moment to understand the principles behind good expense management. Getting a handle on how to track business expenses the right way will give you a solid foundation for everything that follows. Remember, setting this up correctly is about more than just making a list; it’s about creating a powerful tool for analysis.
Designing Your Core Columns
Alright, let's lay the groundwork. The columns you choose are the backbone of your entire tracker, and each one should serve a clear purpose. We'll start with the non-negotiables that every single expense tracker needs.
Here's a look at the essential columns you'll want to include and why they're so important for managing your expenses effectively.
Core Columns for Your Expense Tracker
| Column Name | Data Type | Purpose & Example |
|---|---|---|
| Date | Date | Absolutely crucial. This is the date the transaction actually happened, which you'll need for reconciling accounts and spotting trends over time. Example: 10/26/2023 |
| Amount | Currency | The total cost of the item or service. Always format this column as currency ($) to prevent weird calculation errors down the line. Example: $49.99 |
| Category | Text/Dropdown | This is where the magic happens. Classifying each expense helps you see exactly where your money is going. Example: Software, Office Supplies, Travel |
| Merchant | Text | The name of the vendor or store. This is fantastic for seeing how much you're spending with a specific supplier over the year. Example: Amazon, Adobe, Starbucks |
| Payment Method | Text/Dropdown | Knowing how you paid helps track cash flow from different accounts. It’s also a lifesaver when you’re trying to match receipts to your bank statements. Example: Business Credit Card, PayPal, Checking |
| Description | Text | A brief note for context. You’ll thank yourself later when you can’t remember what that random $150 charge from "Tech Solutions Inc." was for. Example: Annual subscription for project management tool |
These six columns form a rock-solid foundation. With just this information, you can get a surprisingly detailed picture of your business's financial health.
The real power of a custom spreadsheet lies in its ability to adapt to your specific business needs. Don't be afraid to add columns that feel unique to you—that's the whole point.
Think about the questions you want your spreadsheet to answer. For instance, are you constantly wondering how much you spend with a single supplier? The ‘Merchant’ column will tell you. Do you need to track spending across different bank accounts? The ‘Payment Method’ column is your best friend.
This simple workflow of creating your template, logging your data, and regularly reviewing your categories is a powerful cycle.
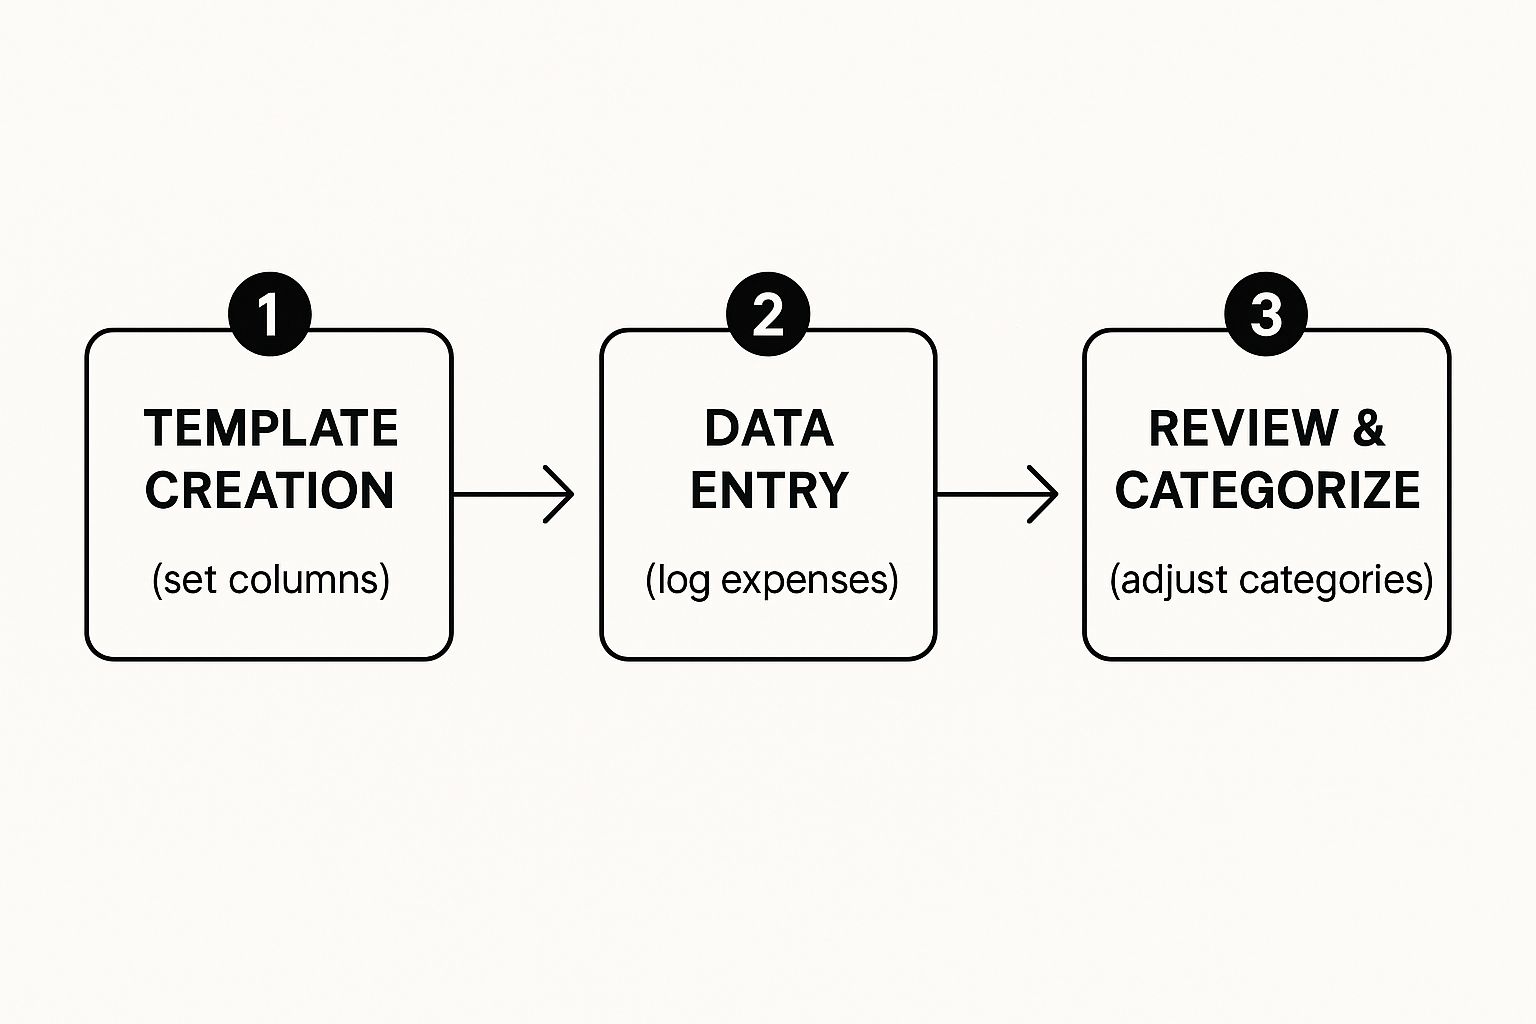
As the visual shows, it’s all about a continuous loop. You log, you review, and you adjust, keeping your financial data clean and genuinely useful.
Columns for More Advanced Tracking
If your business involves client work or reimbursable costs, a couple of extra columns can be a total game-changer.
Freelancers and agencies, listen up: adding a 'Project/Client' column is a must. This lets you assign every single cost to a specific job, making it incredibly easy to see if a project was actually profitable when all was said and done.
Likewise, a simple 'Reimbursable?' column—where you can use a "Yes/No" dropdown or just type "Y"—is perfect for flagging expenses that need to be billed back to a client. It's a simple addition that ensures those costs don't slip through the cracks.
Of course, if building from scratch isn't your thing, a pre-made template can give you a great head start. You can find some excellent options to speed up the process, like those mentioned in our guide to finding the right bank statement Excel template at https://bankstatementconvertpdf.com/bank-statement-excel-template/.
Let Formulas Do the Heavy Lifting for You
A neat list of your expenses is a good first step, but the real power of a spreadsheet is making it do the math for you. Let's be honest, nobody wants to manually add up columns of numbers. It’s not just tedious; it’s a recipe for costly mistakes. With a few key formulas, your simple log can become a dynamic financial dashboard that gives you answers in an instant.
This is the point where your spreadsheet stops being a glorified notepad and starts acting like a smart financial assistant. We’re moving past just typing in numbers and building a system that automatically crunches them. This automation is a huge time-saver for your bookkeeping. If you want to dive deeper into this, learning how to automate data entry can seriously change the way you manage your entire workflow.
Go Beyond the Basic SUM Formula
Most people are familiar with the SUM formula, but the real workhorses for expense tracking are its cousins: SUMIF and SUMIFS. These functions are designed to add up numbers that meet certain conditions, which is exactly what you need to analyze spending by category.
Let's say you need to know exactly how much you dropped on "Marketing" this quarter. Instead of scrolling through your log, hunting down each entry, and adding them up one by one, a formula can do it in a split second.
If your expense categories are in column C and the amounts are in column D, the formula would look something like this: =SUMIF(C2:C100, "Marketing", D2:D100).
This little command tells your spreadsheet to scan everything from cell C2 to C100, find every instance of the word "Marketing," and then add up the matching dollar amounts from column D. Just like that, you get a perfect, error-free total.
Count Your Transactions with COUNTIF
On a similar note, COUNTIF is fantastic for understanding the frequency of your spending. Want to know how many times you bought something from a particular vendor? Or how many separate software subscriptions you're paying for? COUNTIF gives you the answer.
For example, if you wanted to see how many times you ordered from "Amazon" (and you have vendor names in column E), you could use: =COUNTIF(E2:E100, "Amazon"). It’s a simple way to spot spending habits or identify your most important suppliers at a glance.
The whole point of using formulas is to build a "set it and forget it" system. You do the thinking once to set up the logic, and from then on, the spreadsheet handles the calculations as soon as you add a new expense. This frees you up to focus on what the numbers actually mean for your business, not on doing the arithmetic.
Once your expense data is organized, you can start calculating truly important financial metrics. One of the most critical is your profit margin, and you can find a detailed explanation of the profit margin formula in this guide to help you understand your business's real profitability.
Build a High-Level Summary Dashboard
Now for the best part: bringing it all together. I always recommend creating a separate tab in your spreadsheet—call it "Summary" or "Dashboard." This is where you'll pull all your automated totals into one clean, at-a-glance overview of your finances.
On this new Summary tab, create a simple table that lists your main expense categories. Then, right next to each category, you’ll pop in a SUMIF formula to calculate the total spending for it.
Here’s how you could set it up:
- On your "Summary" tab, in Column A: List out your expense categories (e.g., Marketing, Software, Office Supplies, Travel).
- In Column B (next to each category): Place the
SUMIFformula that pulls data from your main log. For your "Marketing" total, the formula might be:=SUMIF('Expense Log'!C:C, A2, 'Expense Log'!D:D).
This formula tells your sheet to look at your 'Expense Log' tab, search the entire 'C' column for whatever category name is in cell A2 of your Summary tab, and then add up the corresponding numbers from column D.
The best part? You can just drag that formula down the column for all your other categories. Now you have a summary that updates in real-time every single time you add a new expense. No more manual calculations, ever.
Taking Your Spreadsheet to the Next Level with Customizations
Alright, you’ve got the basic structure and formulas working. Now for the fun part. This is where we turn a simple expense log into a powerhouse of financial insight—a tool that actually helps you make smarter business decisions.
We're going to add a few key features that will save you from headaches and help you spot spending trends you might otherwise miss. The idea is to stop just recording data and start actively analyzing it.
Use Drop-Down Menus to Keep Your Data Clean
Let's be honest, typos happen. But when you accidentally type "Marekting" instead of "Marketing," your SUMIF formulas won't catch it, and suddenly your category totals are completely wrong. I've seen this simple mistake cause hours of frustration.
The easiest way to prevent this is by using drop-down menus for columns like 'Category' and 'Payment Method'. This forces every entry to be standardized. No more guesswork, no more typos.
In Google Sheets or Excel, this is done with the Data Validation tool. You just make a list of your official categories somewhere—I like to use a separate tab to keep things tidy—and then tell the data validation rule to use that list. From then on, you'll select a category from the menu instead of typing it out.
This small change is a massive win for data integrity. It ensures you’re working with clean, consistent information, which is the bedrock of any reliable financial analysis. If you put clean data in, you'll get trustworthy insights out.
Make Important Numbers Jump Out with Conditional Formatting
Wouldn't it be great if your spreadsheet could flag big-ticket items for you automatically? That's exactly what conditional formatting does. It changes how a cell looks—its color, its text—based on rules you create.
It’s a simple but powerful visual cue that directs your attention where it's needed most. For example, you could set a rule to highlight any expense in your 'Amount' column that’s greater than $500.
- Rule: If the cell's value is over 500
- Format: Change the background to light red
Instantly, all your major expenses are highlighted, making them easy to spot during a quick review. You can get creative here, too. Set up rules to flag specific vendors, recurring subscriptions, or expenses tied to a particular project. It makes scanning your data so much faster.
See the Big Picture with Simple Pivot Tables
If you're managing expenses across multiple projects or clients, a pivot table will be your new best friend. It lets you slice, dice, and summarize your data in seconds, all without writing a single new formula.
Let’s say you have a 'Project/Client' column in your tracker. A pivot table can instantly crunch the numbers and show you the total amount spent on each individual client. This transforms your business expense tracking spreadsheet into a profitability tool. You can finally see, clear as day, which clients are your most resource-intensive.
This is what truly separates a basic list from a strategic dashboard. Many of the more advanced, industry-specific templates run with this idea, sometimes featuring up to 14 different tabs for things like mileage and sales. All that data then feeds back into a central Expense Tab. It’s an approach that roughly 54% of mid-sized small businesses now use to get a better handle on their finances. If you're curious, you can find out more about these advanced spreadsheet solutions and see just how powerful they can get.
Keeping Your Financial Records Clean and Accurate

Let's be honest: even the most perfectly designed business expense tracking spreadsheet is useless if the data is a mess. Inaccurate or incomplete entries will give you a skewed view of your finances, turning your helpful tool into a source of frustration. The secret to avoiding this mess isn't complicated—it's about building simple, consistent habits for entering and reviewing your numbers.
I treat it less like a chore and more like a non-negotiable business ritual. I block off 30 minutes on my calendar every single Friday afternoon just to update my spreadsheet. This simple routine prevents expenses from piling up into a dreaded task and means my financial picture is never more than a few days out of date.
Developing a System for Data Integrity
Consistency is your best friend when it comes to preventing errors. I’ve seen it time and again: someone logs an expense under "Software" one week and "SaaS Subscriptions" the next. This tiny mistake completely breaks your SUMIF formulas and throws off your spending totals. This is exactly why using the drop-down menus we set up earlier is a game-changer.
Another habit that has saved me countless headaches is getting serious about organizing digital receipts. My system isn't fancy, but it works flawlessly:
- I created a main folder in my cloud storage called "Business Receipts," with subfolders for each year.
- Inside each year's folder, I have monthly folders (e.g., "01-January," "02-February").
- Every single time I get a digital receipt, it immediately gets saved to the correct month's folder. No exceptions.
This simple structure means I can find any receipt in seconds, whether it's for an audit, a client reimbursement, or a product return.
Your spreadsheet tells the financial story of your business. Keeping the data clean ensures that story is true and accurate, giving you a reliable foundation for making smart decisions. Don't let small, lazy mistakes create big problems later on.
The Monthly Reconciliation Check-In
To catch any discrepancies before they snowball, you need to do a quick reconciliation at the end of each month. This just means comparing the transactions in your spreadsheet against your business bank and credit card statements to make sure everything lines up.
Think of this monthly check-up as your financial safety net. It’s how you'll spot that small cash purchase you forgot to log or a duplicate charge you need to dispute. For a deeper dive, our guide on how to do bank reconciliation in Excel breaks it down step-by-step. This simple review process builds the confidence that your records are not just accurate, but audit-ready.
Got Questions? Let's Troubleshoot Your Expense Spreadsheet
No matter how dialed-in your system is, you're going to have questions. It just happens. Let’s walk through some of the most common snags people hit when they’re wrestling with a business expense tracking spreadsheet. Getting a handle on these details is what gives you real confidence in your numbers.
How Often Should I Be Updating This Thing?
Honestly, consistency is everything. For most freelancers and small businesses, I’ve found that blocking out time once a week is the sweet spot. It's frequent enough to prevent that dreaded shoebox full of crumpled receipts from piling up, and it keeps your financial picture reasonably up-to-date.
Now, if you’re running something with a ton of daily transactions—think a bustling coffee shop or a busy online store—you might need to make it a daily habit. The real trick is to make it a non-negotiable routine. Seriously, put a recurring appointment in your calendar and treat it like a meeting with your most important client.
What Are the Must-Have Expense Categories?
Every business is a little different, but some categories are pretty much universal. If you're building your first expense tracker, start with this core group:
- Office Supplies: Your everyday stuff—paper, ink, pens, etc.
- Marketing & Advertising: This is where you track your spending on ads, social media campaigns, and promotional materials.
- Software & Subscriptions: For all those recurring charges for digital tools and SaaS products.
- Utilities: Your workspace costs, like internet, phone, and electricity.
- Travel: For any business-related flights, hotels, and ground transportation.
- Professional Fees: For when you hire an accountant, lawyer, or consultant.
Here’s a pro tip: have a quick five-minute chat with your accountant. Make sure your categories line up with what’s considered tax-deductible in your area. That one conversation can save you a world of pain come tax season.
While your spreadsheet is perfect for logging what you need to bill back to a client, it's not the right tool for creating the actual invoice. Use it as your single source of truth for the numbers, then plug that info into a proper invoicing template or software to create a professional document.
When Is It Time to Ditch the Spreadsheet for Software?
Look, I love a good spreadsheet, but they have their limits. You’ll know it’s time to move on to dedicated accounting software when you start feeling a few specific growing pains.
The biggest red flag? When manual data entry starts eating up your life. If you’re spending more than a couple of hours a month just keying in receipts, that's time you're not spending on actually making money. Other tell-tale signs are when you need to track expenses for a team or you start dreaming of features like automatic receipt scanning and bank feed integrations. Once your transaction volume makes the spreadsheet feel slow, clunky, and error-prone, a software subscription usually pays for itself pretty quickly.
Tired of manually typing in every line from your bank statements? It’s slow and a recipe for typos. Bank Statement Convert PDF is built to solve that exact problem, turning your PDF statements into perfectly organized Excel files in just a few seconds.
Learn more and streamline your workflow at https://bankstatementconvertpdf.com