
If you're a business owner, accountant, or anyone in finance, knowing how to build a complete financial statement in Excel is a core skill. It’s all about putting together the three key reports—the income statement, balance sheet, and cash flow statement—to truly understand a company's financial health. Getting this right in a spreadsheet gives you a level of control and flexibility you just can't get anywhere else.
Why Excel Is Still Essential for Financial Reporting
With all the specialized accounting software out there, you might think Excel is a thing of the past. Not even close. In the finance world, it’s still the king, and for good reason. It’s not just about what people are used to; it’s about its incredible flexibility and the fact that everyone has it.
Pre-packaged software can box you in, forcing you to use their rigid formats. Excel, on the other hand, is a blank slate. You can build financial models that are perfectly molded to your company's specific needs.
That's why finance teams always seem to come back to it. A recent report showed that a staggering 96% of finance teams still use spreadsheets for their planning, and 93% use them for reporting. This just goes to show how essential Excel remains for fundamental financial work.
The Power of Customization
The real magic of building your financial statements in Excel is the sheer amount of control you have. You're not just plugging numbers into a template; you're building a dynamic tool.
- Design custom views: You can easily set up dashboards or summary reports that spotlight the Key Performance Indicators (KPIs) that matter most to your business.
- Play with different scenarios: What happens if sales jump 15%? Or if a major expense doubles? In Excel, you can tweak assumptions and instantly see the ripple effect across all three statements.
- Mix in non-financial data: Want to see how website traffic or customer acquisition costs connect to your revenue? Excel lets you pull in operational metrics for a much richer analysis than most off-the-shelf software can provide.
The ability to link cells, create dynamic formulas, and visualize data makes Excel more than just a calculation tool. It becomes an analytical engine that empowers you to understand the story behind the numbers.
Navigating the Spreadsheet Trap
Of course, with all that freedom comes a bit of risk. We've all heard of—or experienced—the "spreadsheet trap." This is where a file becomes so complex and tangled that it's nearly impossible to manage, and errors start creeping in.
Thankfully, you can sidestep this. By using modern Excel features like Tables, named ranges, and data validation, you can build in structure and safeguards to keep your models clean and accurate.
Ultimately, learning to build financial statements in Excel is less about data entry and more about critical thinking. It forces you to understand how the numbers connect. It's the first step toward learning how to analyze financial statements and making sharp, data-backed decisions. If you need a refresher on the basics, our guide on what is a financial statement is a great place to start.
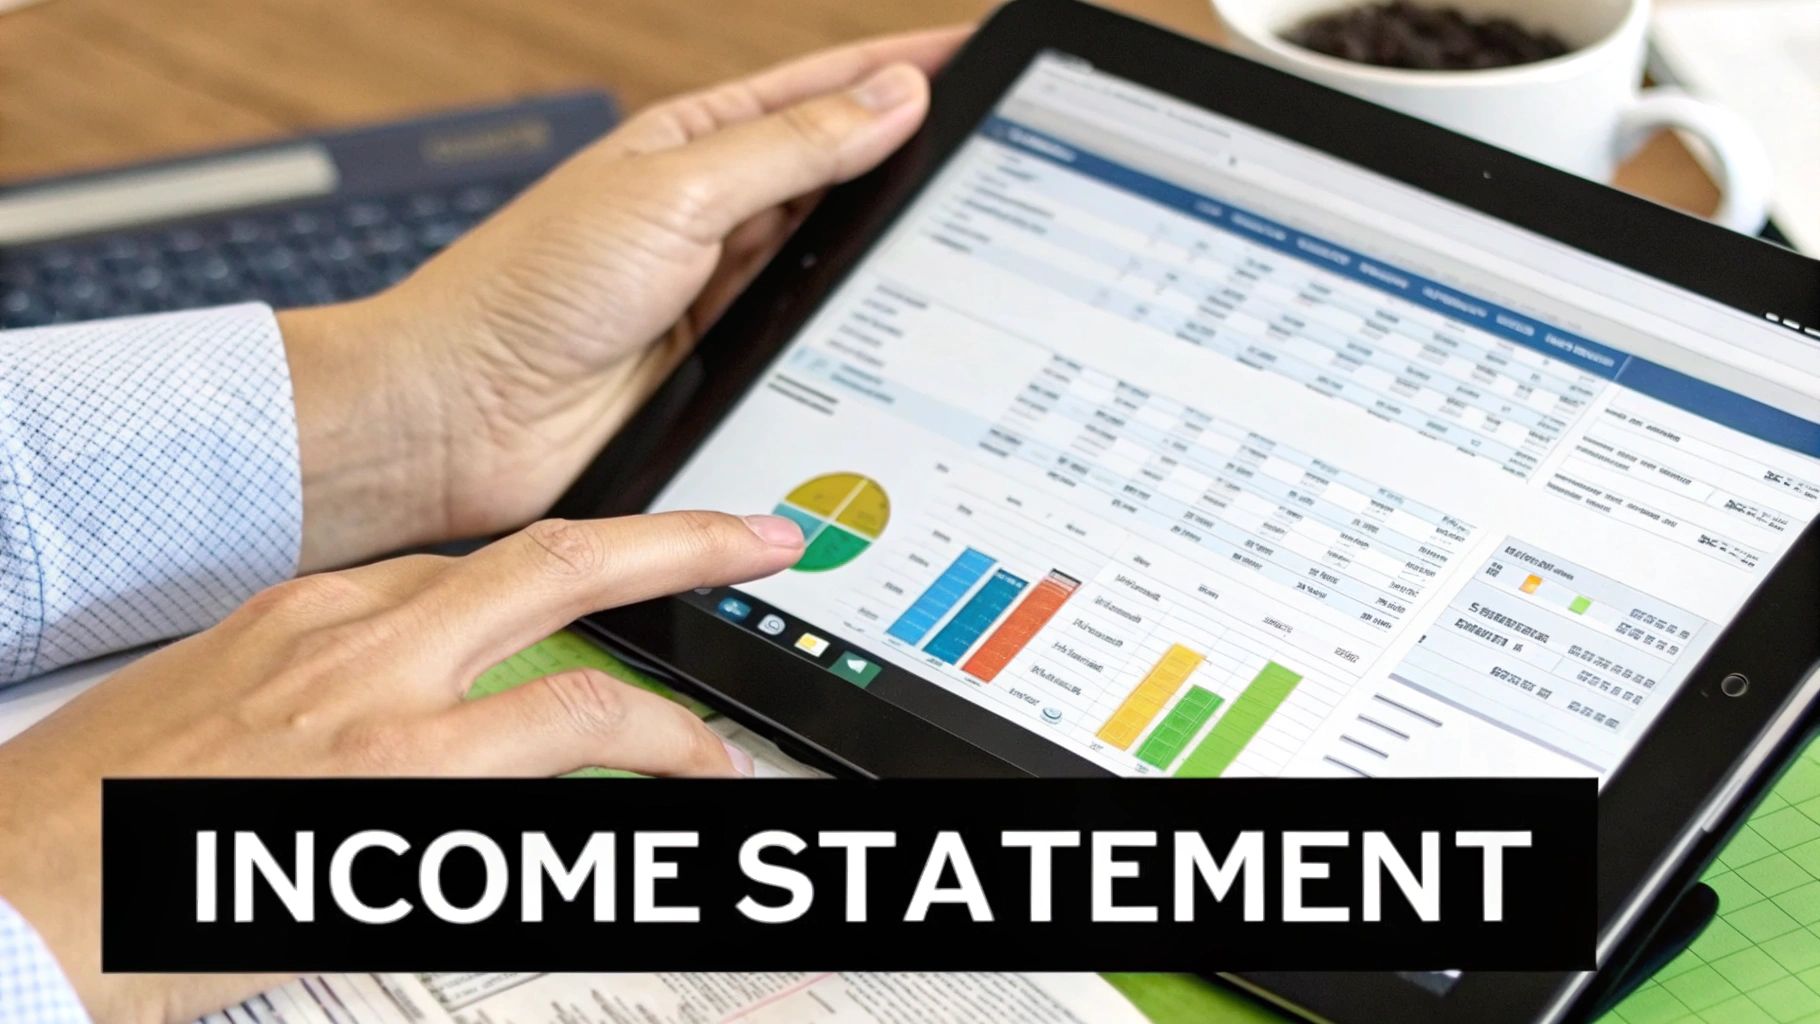
How to Build Your Income Statement

The income statement, which many people know as the Profit and Loss (P&L) statement, tells the story of your business's financial health over a certain time. It really boils down to one critical question: "Are we actually making money?" Getting this part of your financial statement in Excel right is the first major step toward truly understanding your company’s profitability.
Let's walk through this with a practical example. Imagine you run a small e-commerce business selling handmade leather goods. The first thing you'll do is open a fresh Excel sheet and map out the basic structure. Think of this less as just typing in data and more as creating a logical flow that tells your financial story from the top line down to the bottom line.
Laying Out the Core Components
Before you even think about plugging in numbers, your first job is to list the key line items that form the skeleton of any income statement. A clean setup at this stage will save you a world of trouble later on.
In column A, start by creating rows for these essential components:
- Revenue: This is the total cash you've brought in from sales. For our leather goods shop, it’s the sum of every belt, wallet, and bag sold.
- Cost of Goods Sold (COGS): These are the direct costs tied to creating your products—think raw leather, thread, and the labor that went into crafting each item.
- Gross Profit: Your first real checkpoint for profitability, calculated simply as Revenue minus COGS.
- Operating Expenses: All the other costs of keeping the lights on that aren't directly part of the production process.
- Net Income: The final number, what everyone calls the "bottom line."
A simple pro tip is to indent sub-items like COGS and the individual Operating Expenses. It’s a small formatting trick, but it makes the statement infinitely easier to scan and understand.
Populating with Data and Formulas
With the structure in place, it’s time to breathe some life into it with real numbers and formulas. Let's say your e-commerce shop brought in $50,000 in revenue last quarter. Your COGS for that period, adding up all materials and direct labor, came to $15,000.
Your Gross Profit is the first calculation we'll make. In the cell right next to your "Gross Profit" label, you'll type in a straightforward formula. If your Revenue is in cell B2 and COGS is in B3, the formula is just =B2-B3. Bam—a Gross Profit of $35,000.
Next up are your Operating Expenses. For better insight, it's always a good idea to break this category down.
| Expense Category | Amount |
|---|---|
| Marketing & Ads | $5,000 |
| Website Hosting | $500 |
| Shipping Supplies | $1,500 |
| Office Rent | $3,000 |
| Total Expenses | $10,000 |
To get the total, use the SUM function. If those expenses are in cells B6 through B9, you’d type =SUM(B6:B9) in the "Total Expenses" cell.
Now for the grand finale: calculating your Net Income. This is your Gross Profit minus your Total Operating Expenses. Using our example, the formula would be
=B4-B10, leaving you with a Net Income of $25,000. This number is incredibly important because it's the thread that connects your income statement to both your balance sheet and cash flow statement.
Putting Together a Dynamic Balance Sheet
Once you've mapped out your profitability with the income statement, the next step is building the balance sheet. I like to think of the balance sheet as a financial photograph—it’s a snapshot of your company's health at a specific moment. It lays out everything your business owns (Assets), everything it owes (Liabilities), and what's left over for the owners (Equity).
The whole point is to make sure it all ties back to that fundamental accounting equation: Assets = Liabilities + Equity. Excel is brilliant for this because we can set it up to be dynamic, essentially creating a report that checks its own work.
Laying Out Your Assets
First things first, create a dedicated section for your Assets. The standard approach, and the one I recommend for clarity, is to split them into two distinct groups. This gives anyone reading the statement a quick sense of your company's liquidity.
- Current Assets: These are the assets you expect to convert into cash within a year. Think of things like the cash in your bank account, accounts receivable (money customers owe you), and any inventory you're holding.
- Non-Current Assets: You'll also see these called long-term assets. They're investments that will provide value for more than one year, such as property, plant, and equipment (PP&E), long-term investments, or intangible assets like patents.
In your spreadsheet, just use a simple SUM formula at the bottom of each of these groups, and then one more to get your Total Assets. This clean structure makes a world of difference when you're trying to analyze the numbers later.
Detailing Liabilities and Equity
Now for the other side of the equation: Liabilities and Equity. Just as we did with assets, we'll categorize liabilities based on when they're due.
Your Current Liabilities are debts that need to be paid within one year. This includes your accounts payable (what you owe suppliers) and any short-term loans. Non-Current Liabilities are the longer-term obligations, like a multi-year business loan. Sum these up to get your Total Liabilities.
Right below that, you'll build out the Equity section. This part usually contains two key items:
- Common Stock: The original cash injection from investors.
- Retained Earnings: This is the accumulated net income that the business has held onto over time instead of paying out as dividends. It's a crucial link—you’ll pull this number directly from your income statement.
When you add Total Liabilities and Total Equity together, you get the second half of our balancing equation. If you want to dig deeper into keeping your financial records straight, our guide explaining what general ledger reconciliation is is a great resource.
Creating the Balancing Check
This is where the magic happens and your sheet becomes "dynamic." The best part about using Excel is that you can build in a simple, automated check to confirm that your balance sheet actually balances.
Pick a cell at the bottom of the sheet and label it "Check" or "Balance Status." Here, we'll use a simple but powerful IF formula. For example, if your Total Assets value is in cell B15 and your Total Liabilities & Equity is in B25, the formula would be:
=IF(B15=B25, "OK", "ERROR")
This little formula is a lifesaver. It gives you an instant visual cue: "OK" means everything ties out perfectly. If you see "ERROR," you know immediately that something's off and you need to backtrack. It transforms a static report into an intelligent, self-auditing tool.
To help you get started, here's a quick reference table of the most common Excel formulas you'll be using as you build out your financial statements.
Key Excel Formulas for Financial Statements
This table breaks down the essential functions that form the backbone of any financial model in Excel.
| Formula | Purpose | Example Application |
|---|---|---|
| SUM | Adds a range of numbers together. | =SUM(B2:B10) to calculate Total Current Assets. |
| IF | Performs a logical test and returns one value for a TRUE result and another for FALSE. | =IF(B15=B25, "OK", "ERROR") for the balance sheet check. |
| VLOOKUP | Finds data in a table by looking up a value in the first column. | =VLOOKUP("Revenue", A1:B20, 2, FALSE) to pull a specific line item. |
| EOMONTH | Returns the last day of the month for a given date. | =EOMONTH(A1, 0) to create monthly column headers. |
| SUMIF | Adds cells in a range that meet a specific criterion. | =SUMIF(A:A, "Salaries", B:B) to total all salary expenses. |
Getting comfortable with these formulas will not only speed up your workflow but also significantly reduce the chance of manual errors.
Assembling The Cash Flow Statement
Here's a hard lesson many business owners learn: profit on the income statement doesn't always mean cash in the bank. The cash flow statement is what bridges that gap. It’s the ultimate reality check, showing how money actually moves in and out of your company.
To build this in Excel, you’ll pull information from both your income statement and your balance sheet. We’ll be using the indirect method, which is the most common approach for a good reason—it starts with a number you’ve already figured out: Net Income.
Starting With Net Income
Your journey into your true cash position begins right at the top, in the "Cash Flow from Operating Activities" section. The very first line item here is Net Income.
This is a perfect time to link your worksheets together. Instead of retyping the number, just type an equals sign (=) in the cell and then click over to your income statement sheet and select the final Net Income figure. Your formula might look something like ='Income Statement'!B20. This simple link is incredibly powerful. Now, any change to your P&L automatically updates here, keeping everything in sync and cutting down on manual errors.
Adjusting For Non-Cash Items
Next, you have to reconcile your net income (which is an accrual-based figure) with the actual cash you have. This means adding back any expenses that reduced your profit on paper but didn't actually involve cash leaving your business.
- Depreciation and Amortization: These are the classic examples. You recorded them as expenses, but no cash was actually spent during the period. You need to add these values back to your Net Income.
- Gains or Losses on Asset Sales: Let's say you sold an old piece of equipment. The profit or loss is on your income statement, but the cash from that sale belongs in the investing activities section. You'll need to back out the gain or loss here to avoid counting it twice.
This step is all about stripping away the accounting entries to get a clear picture of the true cash impact of your operations.
The core idea is simple: You're adjusting your bottom-line profit to reflect what truly hit your bank account. It's about translating accounting profit into cash reality.
Structuring The Three Core Activities
A complete cash flow statement is organized into three distinct sections, each telling a different part of your financial story.
- Operating Activities: This is all about the cash generated from your day-to-day business. After adjusting for those non-cash items, you’ll also factor in changes in working capital accounts like Accounts Receivable and Accounts Payable.
- Investing Activities: This section tracks cash used for buying or selling long-term assets. Think purchasing property, buying new machinery, or selling old equipment.
- Financing Activities: This details how you raise money and pay it back to investors and lenders. It includes things like taking out a loan, repaying debt, or issuing stock.
When you sum the cash flows from these three activities, you get the net change in cash for the period. For a deeper look, check out this guide on https://bankstatementconvertpdf.com/understanding-cash-flow-statements/.
Getting this statement right is critical. Knowing how the cash moves through your business is the first step when you need to safeguard your business from a cash flow crisis. It gives you an unmatched view of your company’s ability to generate cash—the fuel for survival and growth.
Tying the Three Statements Together in a Single Model
Building out each financial report individually is a great start, but the real magic happens when you connect them. A standalone report gives you a snapshot from one angle. A linked, three-statement model in Excel, on the other hand, is a dynamic tool for analysis. This is how you weave separate sheets of data into a single, cohesive financial story.
The whole process hinges on a few crucial connections that link your income statement, balance sheet, and cash flow statement. Getting these links right isn't optional—it's what makes the model work. They ensure that if you tweak one assumption, like a sales forecast, the effects ripple through your entire financial picture logically.
The Key Connection Points
The first, and most important, link is Net Income. This number, the bottom line of your income statement, is the primary bridge connecting to the other two statements.
- Net Income to Cash Flow: Your Cash Flow from Operating Activities section should always start with Net Income. You'll want to create a direct link here. Just set the cell in your cash flow statement equal to the Net Income cell on your income statement. The formula looks something like this:
='Income Statement'!B20. - Net Income to the Balance Sheet: Net Income also flows directly into Retained Earnings on the balance sheet. The formula for your ending Retained Earnings balance is simple: Beginning Retained Earnings + Net Income – Dividends. This calculation ensures your company's cumulative profit is correctly captured in its equity.
Once those are in place, there’s one final step that closes the loop and serves as the ultimate sanity check for your model.
The true test of your integrated financial statement in Excel is making sure the ending cash balance from your cash flow statement perfectly matches the cash amount listed under Current Assets on your balance sheet. When those two numbers are identical, you know your model is balanced and dynamically linked.
Why Does This Integration Matter?
This interconnected structure is precisely what makes your spreadsheet so powerful. Let's say you're exploring a new pricing strategy. You can adjust your revenue projections on the income statement and literally watch the changes update your Net Income, flow through to Retained Earnings and cash flow, and ultimately rebalance your entire balance sheet automatically.
It's interesting to see how different types of businesses use these tools. A 2021 study on spreadsheet usage revealed that younger companies often gravitate toward cloud platforms like Google Sheets, while more established organizations overwhelmingly stick with Microsoft Excel for this kind of detailed financial modeling.
This visual shows a simple workflow for taking your finished statements and analyzing key financial ratios using Excel's own formatting tools.

By applying conditional formatting to ratios like Debt-to-Equity, for instance, you can make areas of strength or concern jump right off the page. This turns a wall of numbers into clear, actionable insights. Nailing this integrated model is a fundamental skill, and you can dive deeper into the principles behind it with our guide on financial reporting best practices.
Common Questions About Building Financial Statements in Excel
Even with the best guide, your first time building a financial statement model in Excel is bound to throw a few curveballs your way. It's totally normal. Let's walk through some of the most common issues that pop up and how to handle them like a pro.
One of the first questions I always get is about how to structure the data. My advice is always the same: keep your raw data—like a detailed transaction list or a trial balance—on a completely separate worksheet. Your financial statements should be clean summary reports that pull from that source data. This separation is key. It keeps your raw numbers safe from accidental changes and makes the final reports much easier to read and troubleshoot.
How to Handle Common Errors
That moment of panic when your balance sheet doesn't balance? We've all been there. Before you start tearing your model apart, take a breath. It's almost always a simple fix. First, just double-check your core formula: Assets = Liabilities + Equity.
If the formula itself is right, the problem is likely a broken link between your statements. Run through this quick checklist:
- Net Income Flow: Is the Net Income from your Profit & Loss statement actually flowing into the Retained Earnings calculation on your balance sheet? It's a common miss.
- Cash Connection: Does the final, ending cash balance from your cash flow statement match the cash line item on your balance sheet? They have to be identical.
- Sign Errors: This one gets people all the time. A number that should have been negative was entered as a positive, or vice-versa. Scrutinize your signs.
I always tell people to think of their model as a waterfall. An error at the top (like in your revenue calculation) will flow all the way down and throw everything else off. If you trace the connections logically, starting with Net Income, you'll usually pinpoint the problem pretty quickly.
Can You Make a Reusable Template
Yes, and you absolutely should. Once you've built your three statements and confirmed they're all linked up correctly, you’ve basically created a powerful template. To make it official, just save the file as an Excel Template (.xltx).
Doing this creates a master copy. When it's time for the next reporting period—be it monthly, quarterly, or annually—you just open that template, and it creates a fresh, clean workbook for you. All your formulas, formatting, and the crucial links between the statements are already in place. All you have to do is drop in the new raw data, and your entire financial statement model updates automatically. It's a massive time-saver and guarantees your reports are consistent every single time.
Tired of manually typing up your financial data? Bank Statement Convert PDF has software that can instantly turn your PDF bank statements into perfectly organized Excel spreadsheets. This can cut hours of tedious work from your process.
Check out how to get started and build your statements faster.