If you've ever looked at a business's income statement, you've probably seen a line item for Cost of Goods Sold (COGS). It sounds a bit technical, but the concept is actually pretty straightforward.
At its core, COGS represents the direct costs tied to producing the specific goods your business sells. This isn't about your total business spending; it’s about the money you spent to create the actual products that ended up in your customers' hands. Getting this number right is the first, crucial step in understanding how profitable your business really is.
Decoding Your Direct Production Costs
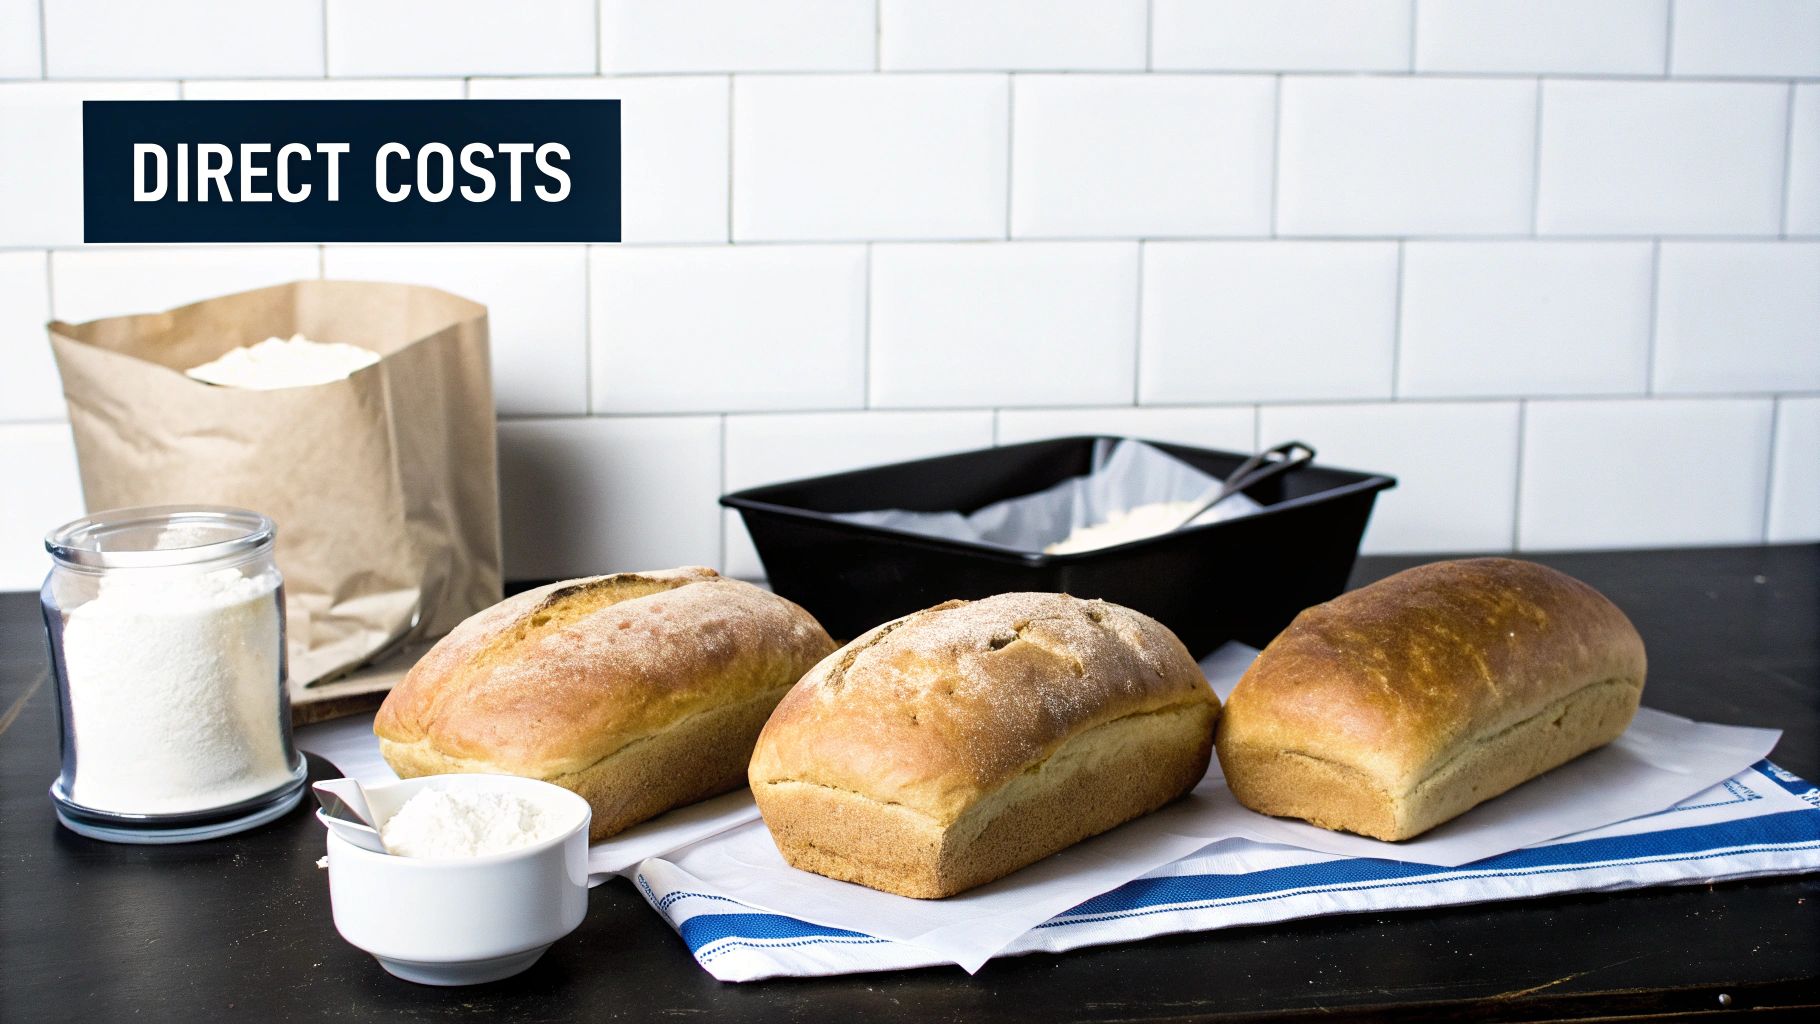
Let’s use a simple analogy: a local bakery. For every loaf of bread they sell, the COGS would include the cost of the flour, yeast, and sugar. It would also include the wages paid to the baker who physically mixed, kneaded, and baked that loaf.
What wouldn't be included? The salary of the person running their social media, the rent for the storefront, or the cost of the new cash register. Those are all vital expenses, but they’re considered operating expenses—the costs of keeping the lights on, not the costs of making the bread itself.
This distinction is more than just accounting jargon; it’s fundamental to your financial health.
Key Components of COGS
So, what exactly falls under the COGS umbrella? It's helpful to think of it in three main buckets:
- Direct Materials: This is the easy one. It’s all the raw stuff that becomes part of your final product. For a furniture builder, that’s the wood, screws, varnish, and drawer handles.
- Direct Labor: This covers the pay for employees whose hands are directly involved in creating the product. Think assembly line workers, machinists, or, in our example, the baker.
- Manufacturing Overhead: These are the factory-related costs that are necessary for production but aren't tied to a single item. This includes things like the electricity to run the factory machines, depreciation on that equipment, and shop supplies like cleaning agents or safety gear.
Breaking Down Your COGS: What to Include vs. Exclude
It can be tricky to distinguish what counts as a direct cost versus a general business expense. This table breaks it down clearly.
| Expense Category | Included in COGS? | Example |
|---|---|---|
| Raw Materials | Yes | Wood for a table, fabric for a t-shirt, flour for bread |
| Production Labor | Yes | Wages for an assembly line worker or a machine operator |
| Factory Utilities | Yes | Electricity and water used in the production facility |
| Shipping & Freight-In | Yes | Cost to get raw materials delivered to your factory |
| Sales & Marketing | No (Operating Expense) | Social media ads, salesperson commissions, brochures |
| Administrative Salaries | No (Operating Expense) | Salary for the CEO, accountants, or HR staff |
| Office Rent & Utilities | No (Operating Expense) | Rent for your corporate headquarters, office internet |
| Shipping to Customers | No (Operating Expense, sometimes listed as "Fulfillment") | The cost of sending the finished product to the buyer |
As you can see, the key is whether the expense is directly tied to the creation of the product. If it happens in the factory, it’s likely COGS. If it happens in the front office, it’s probably an operating expense.
Let's put it into practice. Imagine a toy company spent $2 million on plastic, $1 million on wages for its factory workers, and $500,000 on the factory's electricity bill for the year. Its total COGS would be $3.5 million.
Separating these direct costs from your day-to-day operating expenses is essential. It tells you how efficiently you’re producing your goods and gives you the insight needed to set prices that actually lead to profit. You can learn more about how all these figures come together by exploring our guide to understanding essential financial statements.
Mastering the COGS Formula for an Accurate Calculation

Figuring out your Cost of Goods Sold doesn’t require fancy software or a degree in finance. At its heart, it’s a simple but powerful formula that gives you a clean look at your production costs over a set period. Once you get a feel for its moving parts, the equation stops being an abstract concept and becomes a go-to tool for financial clarity.
The formula is surprisingly straightforward, built on just three key numbers from your business. Each one tells a part of your inventory's story over a specific accounting period—whether that’s a month, a quarter, or a full year.
The Core COGS Formula:
(Beginning Inventory + Purchases) – Ending Inventory = Cost of Goods Sold
Let’s pull back the curtain on each piece to see how they fit together. Think of it as tracking your stock from the starting line to the finish line.
Unpacking Each Element of the Formula
To use this formula effectively, you need to know exactly what each term means for your business.
-
Beginning Inventory: This is simply the value of all the stock you had on hand the moment the accounting period started. It's the same number as your ending inventory from the previous period.
-
Purchases: This is the cost of all the new inventory you bought during the period. It should include the cost of raw materials, finished goods you plan to resell, and any shipping costs you paid to get those items to your warehouse (freight-in).
-
Ending Inventory: This is the value of all the inventory you have left—the stuff that's still on your shelves—at the very end of the accounting period. Getting this number right often means doing a physical inventory count.
At its core, this calculation tells you one thing: the total cost of the inventory that left your business because it was sold.
A Practical Example: A Small T-Shirt Business
Let's make this real. Imagine you run a small shop that prints and sells custom t-shirts. We'll calculate your COGS for the first quarter of the year.
-
Beginning Inventory: On January 1st, you had $5,000 worth of blank shirts, ink, and other supplies ready to go.
-
Purchases: Over the next three months, you spent another $10,000 on new t-shirts and printing materials to keep up with orders.
-
Ending Inventory: On March 31st, you take stock. After a busy quarter, you have $4,000 worth of inventory left over.
Now, let’s plug those numbers into our formula:
($5,000 Beginning Inventory + $10,000 Purchases) – $4,000 Ending Inventory = $11,000
Your Cost of Goods Sold for the quarter is $11,000. This is the direct cost tied to the specific t-shirts you sold during that three-month window.
If you want to get better at organizing this kind of data, our guide on creating a financial statement in Excel is a great next step. Getting these numbers right is crucial, and it’s worth noting that new methods are always popping up for improving financial accuracy with AI query tools.
How Inventory Valuation Methods Impact Your COGS
The basic COGS formula looks straightforward on the surface, but things get tricky when the cost of your inventory changes over time. Let's say you bought widgets for $10 in January and then had to pay $12 for the same widgets in March. When you sell one, which cost do you use?
The answer lies in your inventory valuation method. This choice isn't just for the accountants; it directly changes your cost of goods sold calculation, which in turn affects your reported profit and even your tax bill.
Imagine you own a small grocery store and stock milk. The price you pay your supplier keeps creeping up. When a customer grabs a carton, do you assume you sold the oldest, cheapest milk first, or the newest, most expensive one? This is the exact problem these inventory methods solve.
First-In, First-Out (FIFO)
The First-In, First-Out (FIFO) method works just like it sounds: you assume the first items you bought are the first ones you sold. Think of it as good stock rotation in our grocery store—you always push the oldest milk to the front to sell it before it expires.
When prices are on the rise, FIFO gives you a lower COGS. Why? Because you're matching older, cheaper inventory costs against your current revenue. This makes your gross profit look higher, which is great, but it can also mean a bigger income tax bill. Still, it's popular because it often mirrors the actual, physical flow of goods, especially for businesses with perishable products.
Last-In, First-Out (LIFO)
On the flip side, the Last-In, First-Out (LIFO) method assumes the most recently purchased items are the ones sold first. In our grocery store, this would be like putting the newest milk delivery at the front of the shelf and selling it right away.
During inflationary periods, LIFO results in a higher COGS because you're matching the latest, most expensive costs against your revenue. This leads to a lower reported gross profit and, often, a smaller tax liability. It's important to note, however, that LIFO isn't permitted under International Financial Reporting Standards (IFRS) and can sometimes paint a slightly distorted picture of your inventory's actual value.
Weighted Average Cost (WAC)
If FIFO and LIFO are too extreme, the Weighted Average Cost (WAC) method offers a happy medium. It smooths out the price fluctuations by calculating a single average cost for all the goods you have available for sale.
To get this number, you simply divide the total cost of all goods available for sale by the total number of units. This average cost is then applied to every item you sell.
This approach is often simpler to manage since you don't have to track the cost of every individual batch of inventory. It provides a more balanced view that prevents wild swings in your reported profits. Of course, no matter which method you pick, solid record-keeping is a must—it's one of the core bookkeeping basics for small business.
Comparing FIFO, LIFO, and Weighted Average Methods
Choosing an inventory method is a strategic decision. Each one tells a slightly different story about your profitability, especially when costs are changing. This table breaks down the core differences at a glance.
| Method | How It Works | Impact in Rising Prices | Best For |
|---|---|---|---|
| FIFO | Assumes the first items purchased are the first ones sold. | Lower COGS, higher profit, and potentially higher taxes. | Businesses where the first items in should be the first out, like food or electronics. |
| LIFO | Assumes the last items purchased are the first ones sold. | Higher COGS, lower profit, and potentially lower taxes. | Businesses with non-perishable goods where stock rotation isn't critical (e.g., oil, coal). |
| WAC | Calculates an average cost for all inventory items. | Smooths out price fluctuations, providing a middle-ground COGS and profit. | Businesses with homogenous products where individual unit tracking is impractical. |
Ultimately, the best method depends on your specific business, industry norms, and financial strategy. To really get a handle on how these calculations play out, it’s worth exploring the nuances of these different inventory costing methods.
Why COGS Is Your Business Health Checkup
Think of your Cost of Goods Sold as a vital sign for your business, almost like a doctor checking your blood pressure. It's so much more than a number you plug into your income statement; it gives you a direct, unfiltered look into how efficiently you're running things and your overall financial health.
COGS is the starting point for figuring out your gross profit—that's the cash you have left from sales after paying for what it took to make or buy your products. That number then leads you to your gross profit margin, a critical metric that shows how much profit you're squeezing out of every dollar in revenue. A healthy margin is a great sign that you're producing your goods efficiently.
Reading the Warning Signs in Your COGS
A stable, predictable COGS often means you have a stable business. But when that number starts creeping up without a good reason, it’s like a warning light flashing on your dashboard. Something needs your attention.
An increasing COGS could be pointing to a few different problems under the hood:
- Supplier Price Hikes: The cost of your raw materials might be on the rise, directly eating into your profits.
- Production Inefficiencies: Issues on the factory floor, from wasted materials to slower output, can bloat your labor and overhead costs.
- Poor Inventory Management: If your inventory tracking is off or you're using an outdated valuation method, your COGS calculation will be skewed.
Keeping a close eye on COGS trends lets you catch these issues before they turn into bigger headaches. This kind of consistent review is a cornerstone of smart financial statement analysis techniques and is often what separates the businesses that thrive from those that just get by.
Turning COGS Data into Strategic Decisions
When you start treating COGS as a strategic tool, you can make much smarter, data-backed decisions. For example, if your COGS is climbing, it might be the push you need to renegotiate with suppliers for better pricing or to look for more affordable materials. It could also signal that it's time to adjust your own pricing to protect those margins.
Big swings in COGS can point to changes in how well your operations are running or even reflect wider economic shifts. In Europe, for instance, COGS as a percentage of turnover hovered between 60–70% in major economies from 2005–2019. That shows just how massive its impact on profitability really is.
The infographic below breaks down the different inventory valuation methods, each of which has a direct effect on how you calculate COGS.
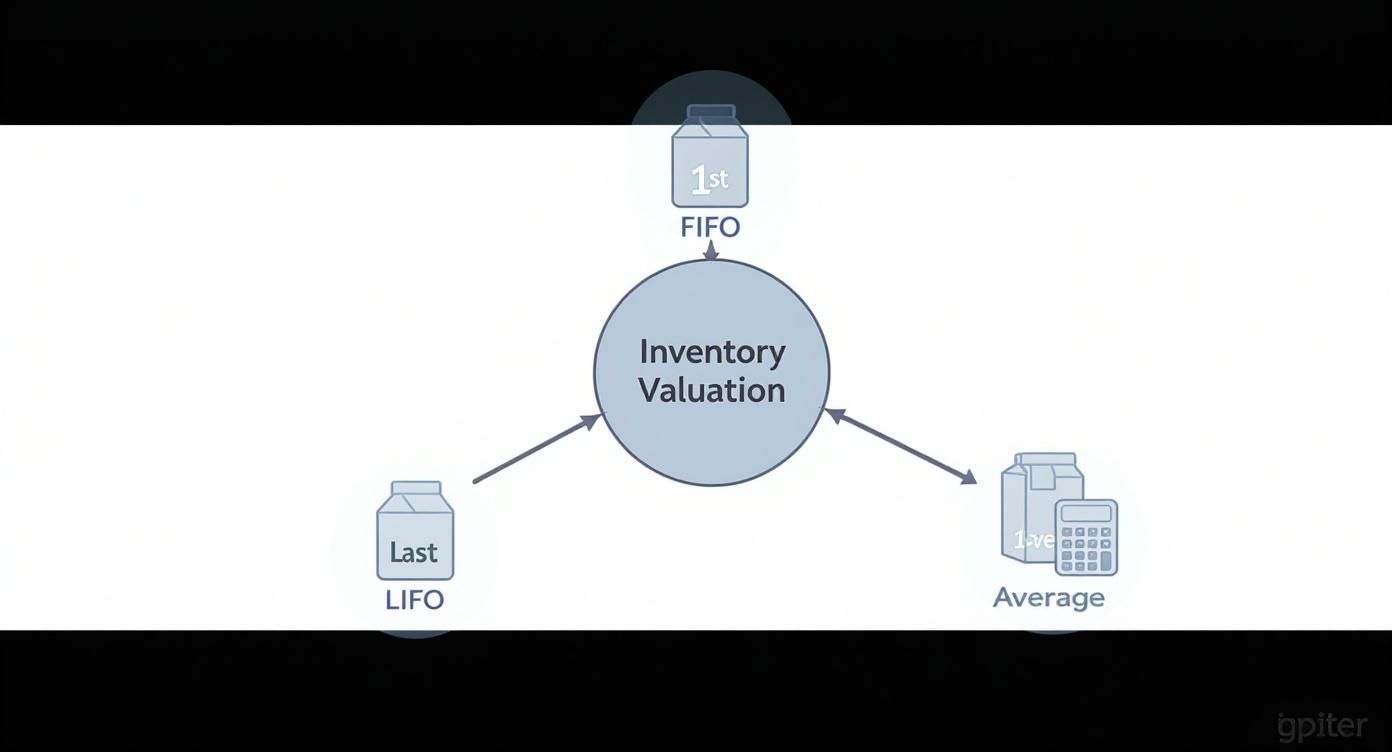
As you can see, choosing between FIFO, LIFO, or Average Cost isn't just an accounting detail. It's a strategic move that can change your reported COGS and profit, especially when your costs are fluctuating. At the end of the day, tracking COGS isn't just about bookkeeping—it's about steering your company toward lasting success.
Putting COGS to Work: How Different Industries Calculate It

The basic COGS formula is the same for everyone, but what you plug into it can change dramatically depending on what you sell. The real trick is getting crystal clear on what counts as a "direct cost" for your specific business.
Seeing the formula in action across a few different industries is the best way to bridge the gap between theory and your own P&L statement. Let's walk through three common scenarios to see how the calculation adapts to different business models.
Example 1: The Retail Clothing Store
For a retailer, life is relatively simple. COGS is almost entirely about the wholesale price of the finished goods they buy and then sell. There's no manufacturing to worry about, so the focus is purely on inventory.
- Beginning Inventory: The shop started the quarter with $30,000 worth of clothes on the racks and in the back.
- Purchases: They ordered $50,000 in new styles from their suppliers.
- Ending Inventory: After the quarter, a physical count showed $25,000 in unsold clothing remained.
The calculation looks like this: ($30,000 + $50,000) – $25,000 = $55,000.
So, the store's Cost of Goods Sold for the quarter was $55,000. That number represents the direct cost of every single shirt, pair of jeans, and jacket that walked out the door with a customer.
Example 2: The Coffee Roastery
Things get a bit more involved for a business that makes something. A coffee roastery’s direct costs include not just the raw materials but also the labor needed to turn those materials into a finished product.
- Beginning Inventory: They started the period with $10,000 in green coffee beans and packaging materials.
- Purchases: They bought $15,000 of new beans and paid their roaster operator $5,000 in wages.
- Ending Inventory: They finished the period with $8,000 worth of unroasted beans and supplies.
Key Difference: Notice how we're lumping raw materials (the beans) and direct labor (the roaster's wages) into the "Purchases" part of the equation. Both are direct costs of production.
Here’s the math: ($10,000 + $15,000 + $5,000) – $8,000 = $22,000.
The roastery’s COGS was $22,000. This figure captures the cost of the beans, the packaging, and the hands-on labor for all the coffee they sold.
Example 3: The Custom Furniture Maker
For a craftsman or manufacturer, the direct costs get even more layered. You've got raw materials, skilled labor, and maybe even some factory overhead to consider.
- Beginning Inventory: The workshop had $20,000 of wood, stains, and hardware on hand.
- Purchases & Production Costs: They spent $15,000 on new lumber and paid their woodworkers $25,000 for the time they spent building the sold pieces.
- Ending Inventory: At the end of the period, they were left with $18,000 in raw materials.
Let's run the numbers: ($20,000 + $15,000 + $25,000) – $18,000 = $42,000.
The furniture maker's COGS came out to $42,000. This comprehensively covers every piece of wood and every dollar of labor that went into creating the custom furniture they delivered to clients.
Diving Deeper: Your COGS Questions Answered
Once you get the hang of COGS, you start bumping into real-world questions that aren't always covered in the textbooks. Let's tackle some of the most common ones that pop up when you're trying to apply this to your own business.
COGS vs. Operating Expenses: What's the Real Difference?
The line between COGS and operating expenses boils down to one simple idea: direct versus indirect costs.
Think about building a wooden chair. The wood, the screws, and the wages for the person physically assembling it are all direct costs. If you don't make any chairs, you don't have those costs. That's your COGS.
Now, think about the salary for your marketing person, the rent for your office, or the cost of your accounting software. You have to pay those bills whether you make one chair or a thousand. Those are Operating Expenses (OpEx). They keep the lights on and the business running, but they aren't tied to a specific product.
In your books, COGS is subtracted from revenue to get your gross profit. OpEx is subtracted from that gross profit to find your operating income.
Do Service Businesses Even Have COGS?
They sure do, though it often wears a different hat. For service-based companies, you'll typically see it called "Cost of Revenue" or "Cost of Sales."
A marketing agency doesn’t stock physical goods, but it definitely has direct costs tied to serving its clients.
The salaries of the designers and writers actively working on a client's campaign are a perfect example of Cost of Revenue. For a SaaS company, this could be the cost of server hosting or the wages of the support team that directly helps customers use the software.
How Does COGS Impact My Business Taxes?
COGS is a huge deal for your taxes because it’s a major business expense. It directly reduces your gross profit, which means you report less taxable income to the government.
Put simply, a higher, accurately reported COGS means a lower profit, which translates to a smaller tax bill. This is exactly why keeping meticulous records is non-negotiable. Your choice of inventory valuation method (like FIFO or LIFO) also plays a big part, changing your reported profit and taxes, especially if your material costs fluctuate.
Tired of manually entering data from bank statement PDFs? Bank Statement Convert PDF can turn those locked documents into clean Excel files in a snap, making your COGS tracking and financial analysis a whole lot easier. Get started today at bankstatementconvertpdf.com.