
Financial statements are more than just tables of numbers; they tell the story of a company's past performance, present health, and future potential. But to truly understand this narrative, you need the right tools to translate raw data into actionable insights. Many business owners and investors glance at the income statement but often miss the critical signals hidden within the balance sheet and cash flow statement, leaving valuable information on the table. For those just starting or looking for a comprehensive overview, an excellent resource provides a practical guide to analyzing financial statements and covers the essential steps.
This article moves beyond the basics, equipping you with a powerful toolkit of specific financial statement analysis techniques. We will break down eight distinct methods that allow you to dissect financial data with precision. You will learn how to identify performance trends over time, compare your company against industry benchmarks, and even assess the underlying quality of reported earnings. Mastering these approaches will empower you to make smarter, more strategic decisions, whether you're steering your own business, advising clients, or evaluating investment opportunities. Let's explore the techniques that transform numbers into a clear financial roadmap.
1. Horizontal Analysis (Trend Analysis)
Horizontal analysis, also known as trend analysis, is one of the foundational financial statement analysis techniques used to evaluate a company's performance over time. It involves comparing financial data from multiple accounting periods, side-by-side, to identify growth patterns, anomalies, and operational trends. This method reveals the direction and speed of change in key metrics like revenue, expenses, and profits.

The core calculation involves selecting a "base year" and then calculating the percentage change for each subsequent period's line items relative to that base. This converts raw financial data into a dynamic story, showing whether a company is expanding, stagnating, or contracting.
How Horizontal Analysis Works in Practice
The formula is straightforward: ((Current Period Amount - Base Period Amount) / Base Period Amount) * 100. This calculation is applied to each line item on the income statement, balance sheet, and cash flow statement.
- Real-World Example: Consider Apple Inc. An analyst could use horizontal analysis on its annual reports to track iPhone revenue. Seeing it grow from $91.3 billion in 2015 to $205.5 billion in 2021 provides a clear, quantifiable measure of the product's sustained market dominance. Similarly, a retailer might use this technique to analyze same-store sales growth, a critical indicator of operational health.
Actionable Tips for Effective Implementation
To get the most out of this technique, apply these practical strategies:
- Select a Representative Base Year: Your base year should reflect a period of normal operations, free from major economic recessions, one-time acquisitions, or other anomalies that could skew the analysis.
- Investigate Significant Variances: As a rule of thumb, any change greater than 10% warrants a closer look. Dig into management's discussion and analysis (MD&A) or financial footnotes to understand the underlying causes.
- Adjust for One-Time Events: To see true operational trends, normalize your data by removing the impact of extraordinary items like asset sales, litigation settlements, or restructuring charges.
- Combine with Vertical Analysis: Horizontal analysis shows trends over time, while vertical analysis (which we'll cover next) shows the proportional size of accounts. Using both provides a much more comprehensive financial picture.
2. Vertical Analysis (Common-Size Analysis)
Vertical analysis, often called common-size analysis, is another essential financial statement analysis technique that evaluates the proportional relationship between items on a single financial statement. Instead of comparing figures over time, this method expresses each line item as a percentage of a base figure from the same period. This standardization creates a "common-size" statement, making it easy to compare companies of different sizes or to analyze a single company's internal structure.
For an income statement, every line item is shown as a percentage of total revenue. On the balance sheet, each item is expressed as a percentage of total assets. This reveals crucial insights into a company's cost structure, profit margins, and asset or liability composition at a specific point in time.
How Vertical Analysis Works in Practice
The formulas are (Income Statement Item / Total Revenue) * 100 and (Balance Sheet Item / Total Assets) * 100. This calculation is applied line-by-line for a single period, effectively converting absolute dollar amounts into relative percentages.
- Real-World Example: Comparing Walmart and a smaller boutique retailer, an analyst might see Walmart’s cost of goods sold is 75% of its revenue, while the boutique's is 50%. This doesn't mean the boutique is more profitable; it simply reflects different business models. Similarly, a SaaS company's common-size income statement might show R&D expenses at 25% of revenue, highlighting its investment in innovation, a key performance indicator for the tech industry. For a deeper dive into creating these statements, you can learn more about preparing a financial statement in Excel.
Actionable Tips for Effective Implementation
To extract meaningful insights from this powerful technique, follow these strategies:
- Compare to Industry Benchmarks: The true power of vertical analysis is in comparison. Analyze your company’s percentages against industry averages to identify areas of competitive strength or weakness.
- Track Margins Diligently: Pay special attention to gross, operating, and net profit margins. A declining gross margin percentage, for instance, could signal rising input costs or pricing pressure.
- Analyze Asset and Liability Composition: On the balance sheet, look at the proportion of current assets to total assets or the mix of debt and equity. A high percentage of inventory could indicate a sales problem.
- Combine with Horizontal Analysis: Using vertical analysis to see the cost structure in a given year and horizontal analysis to see how that structure has changed over time provides a comprehensive view of a company's financial health.
3. Ratio Analysis
Ratio analysis is a cornerstone of financial statement analysis techniques, using quantitative calculations to evaluate a company's performance, liquidity, efficiency, and solvency. By deriving ratios from financial statement data, analysts can gain deep insights into a company's operational health and financial stability, enabling comparisons against industry benchmarks, competitors, and historical trends.

This method categorizes ratios into groups like liquidity, profitability, leverage, and market value, each telling a different part of the company's financial story. Pioneered by figures like Benjamin Graham, it transforms raw numbers into standardized metrics that are comparable across different companies and time periods.
How Ratio Analysis Works in Practice
Ratios are calculated by dividing one financial statement line item by another. For example, the Current Ratio (Current Assets / Current Liabilities) measures short-term liquidity, while the Debt-to-Equity Ratio (Total Debt / Shareholders' Equity) assesses leverage. When conducting ratio analysis, a powerful metric for assessing a company's capital efficiency is the Return on Invested Capital (ROIC).
- Real-World Example: A commercial bank evaluating a loan application will scrutinize the applicant's debt-to-equity ratio, often preferring a value below 2.0 as an indicator of manageable risk. Similarly, an investor comparing tech stocks like Apple might see its P/E ratio of 26 as more attractive than a competitor's at 35, suggesting a potentially better value relative to earnings.
Actionable Tips for Effective Implementation
To derive meaningful conclusions, apply these practical strategies:
- Use a Holistic Approach: Never rely on a single ratio. A comprehensive analysis requires evaluating a combination of ratios across different categories to get a complete picture.
- Benchmark Against Industry Peers: Compare your company's ratios to industry averages (from sources like Dun & Bradstreet) and direct competitors to gauge relative performance and identify competitive advantages or weaknesses.
- Analyze Trends Over Time: A single period's ratio is just a snapshot. Analyzing trends over multiple periods reveals the direction of the company's financial health, whether it is improving, deteriorating, or stable.
- Understand Industry-Specific Norms: Ratios vary significantly by industry. A grocery store might have low profit margins but very high inventory turnover, which is normal for that sector, whereas a software company would have the opposite.
4. Cash Flow Analysis
Cash flow analysis is a critical financial statement analysis technique that examines a company's cash flow statement. It reveals how a company generates and uses cash across operating, investing, and financing activities. Unlike accrual-based net income, this analysis focuses on actual cash movements, providing a clear picture of a company's liquidity and its ability to fund operations, invest in growth, and meet its obligations.

This method is highly valued because cash is less susceptible to accounting manipulation than earnings. It helps answer fundamental questions: Is the company’s core business generating cash, or is it relying on debt to stay afloat? This makes it a powerful tool for assessing a company's true financial health and sustainability.
How Cash Flow Analysis Works in Practice
The analysis involves dissecting the Statement of Cash Flows into its three main components to understand the sources and uses of cash. The ultimate goal for many analysts is to calculate Free Cash Flow (FCF), which is typically Operating Cash Flow minus Capital Expenditures.
- Real-World Example: Before its failed IPO, WeWork's cash flow analysis showed massive negative operating cash flow, indicating its core business model was unsustainable and burning through investor cash. Conversely, a mature company like Coca-Cola consistently generates strong operating cash flow, which it uses to fund dividends and share buybacks, demonstrating a stable and profitable business model.
Actionable Tips for Effective Implementation
To derive deep insights from this technique, apply these practical strategies:
- Compare Operating Cash Flow to Net Income: A ratio of operating cash flow to net income consistently above 1.0 suggests high-quality earnings. A ratio below 1.0 may indicate that reported profits are not translating into actual cash.
- Calculate and Track Free Cash Flow (FCF): FCF represents the cash available to a company after funding operations and capital projects. It's a key metric for valuation and shows the cash available to return to investors.
- Watch for Red Flags: Consistently negative operating cash flow is a major warning sign that a company cannot sustain its operations without external financing. This is one of the most important financial statement analysis techniques for spotting potential distress.
- Distinguish Between Growth and Inefficiency: Negative cash flow isn't always bad. A high-growth company like Amazon in its early years might show negative FCF due to heavy investment in expansion. The key is to determine if cash burn is funding profitable growth or covering operational losses.
5. DuPont Analysis
DuPont Analysis is a powerful financial statement analysis technique that deconstructs Return on Equity (ROE) into its core components. Developed by the DuPont Corporation in the 1920s, it moves beyond a single ROE figure to reveal how a company generates its returns. It breaks down profitability, operational efficiency, and financial leverage to provide a holistic view of performance drivers.
This framework shows that ROE is influenced by three key levers: profit margin (operational efficiency), asset turnover (asset utilization), and the equity multiplier (financial leverage). This concept map illustrates the direct relationship between these three drivers and the central metric of Return on Equity.
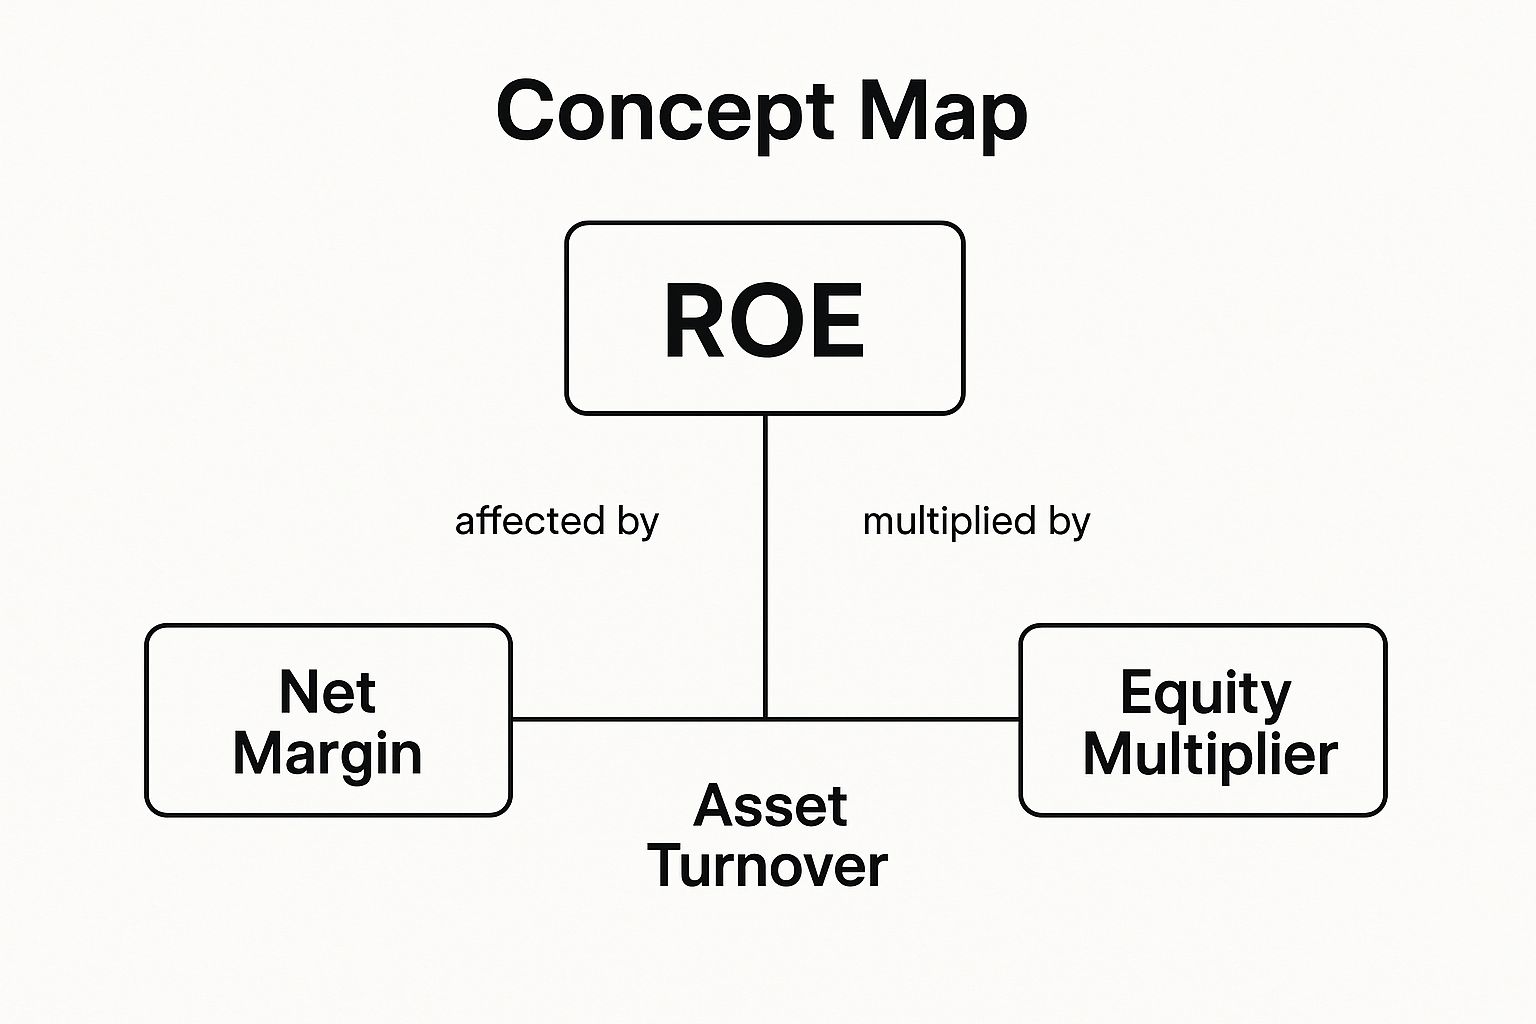
The visualization clearly shows how Net Margin, Asset Turnover, and the Equity Multiplier combine to produce a company's overall Return on Equity, highlighting the distinct paths to profitability.
How DuPont Analysis Works in Practice
The analysis uses the three-step formula: ROE = Net Profit Margin * Asset Turnover * Equity Multiplier. By dissecting ROE, analysts can pinpoint a company's strengths and weaknesses with surgical precision. A high ROE might look impressive, but this analysis reveals if it's due to healthy profit margins, efficient asset use, or risky levels of debt.
- Real-World Example: A comparison between Walmart and Tiffany & Co. perfectly illustrates this. Walmart achieves its ROE through high asset turnover (selling a massive volume of products quickly) and low profit margins. In contrast, a luxury brand like Tiffany achieves a similar ROE through high-profit margins on fewer sales (low asset turnover). Both are successful but use fundamentally different business models, a nuance revealed by DuPont analysis.
Actionable Tips for Effective Implementation
To apply this technique for deeper insights, use the following strategies:
- Compare Components, Not Just ROE: When benchmarking against competitors, analyze each of the three components separately. A competitor might have a similar ROE but achieve it through unsustainable leverage, while your company's ROE is driven by superior operational efficiency.
- Be Wary of High Leverage: A high ROE driven primarily by the equity multiplier (leverage) can be a significant red flag. It indicates that the company is using a lot of debt to amplify returns, which increases financial risk.
- Track Component Trends: Analyze the DuPont components over several periods. Is the company's rising ROE due to improving margins (a good sign of competitive advantage) or increasing leverage (a potential warning)?
- Understand Industry Norms: Context is critical. Retailers typically have high turnover, luxury brands have high margins, and financial institutions rely on high leverage. Compare a company's components to its direct industry peers.
6. Comparative Analysis (Benchmarking)
Comparative analysis, also known as benchmarking, is a powerful financial statement analysis technique used to evaluate a company's performance against its peers, industry averages, or best-in-class competitors. Instead of looking at a company in isolation, this method provides crucial context, revealing its competitive position and highlighting areas of strength or weakness. It answers the critical question: "How are we performing relative to others?"
This technique involves selecting a relevant comparison group and then analyzing key financial ratios and metrics side-by-side. The insights gained are invaluable for strategic planning, operational improvement, and investment decisions, helping stakeholders understand whether the company's performance is a result of industry-wide trends or company-specific factors.
How Comparative Analysis Works in Practice
The process involves identifying appropriate peers or industry standards and then comparing line items or calculated ratios. The comparison can reveal significant differences in strategy, efficiency, and profitability.
- Real-World Example: An analyst comparing Coca-Cola and PepsiCo might find that Coca-Cola has a significantly higher operating margin (around 27% vs. PepsiCo's 15%). This signals a fundamental difference in business models, with Coca-Cola focused on higher-margin beverage concentrates and PepsiCo having a more diversified, lower-margin portfolio including snack foods. Similarly, a SaaS company might benchmark its customer acquisition cost (CAC) against the industry average to gauge the efficiency of its marketing spend.
Actionable Tips for Effective Implementation
To derive meaningful insights from benchmarking, apply these strategies:
- Select Truly Comparable Peers: Choose companies with similar business models, sizes, and geographic markets. Comparing a global enterprise to a small regional player will yield misleading results.
- Use a Sufficiently Large Peer Group: Benchmark against a group of 5-10 comparable companies rather than just one direct competitor to smooth out individual anomalies and get a more reliable industry picture.
- Adjust for Accounting Differences: Before comparing, investigate whether companies use different accounting policies (e.g., LIFO vs. FIFO inventory valuation) and make adjustments to ensure a true apples-to-apples comparison.
- Look Beyond Financials: Supplement financial ratio comparisons with operational KPIs specific to the industry, such as same-store sales for retailers or R&D spending as a percentage of revenue for pharmaceutical firms. Utilizing various business intelligence tools can help aggregate and compare these diverse datasets effectively.
7. Quality of Earnings Analysis
Quality of earnings analysis is an advanced financial statement analysis technique that scrutinizes the sustainability and reliability of a company's reported profits. It aims to distinguish high-quality earnings, which are sustainable and backed by actual cash, from low-quality earnings driven by aggressive accounting, one-time events, or financial manipulation. This method goes beyond the surface-level net income figure to assess the true economic performance of a business.
This analysis is critical for investors and creditors, as it reveals whether a company's profits are a true reflection of its core operational health or merely an accounting construct. It answers the crucial question: are these earnings real and repeatable?
How Quality of Earnings Analysis Works in Practice
The process involves a forensic examination of the income statement and its relationship with the balance sheet and cash flow statement. Analysts look for red flags that might indicate earnings have been artificially inflated, such as aggressive revenue recognition or the capitalization of routine expenses. The goal is to separate recurring, cash-generating profits from temporary or misleading components.
- Real-World Example: Before its collapse, Enron reported impressive earnings growth, but a quality of earnings analysis would have revealed a massive divergence between its reported profits and its actual operating cash flow, which was often negative. Similarly, analysts scrutinize Tesla's earnings by separating profits from core automotive sales from those generated by selling regulatory credits, which are less predictable and not part of its primary operations.
Actionable Tips for Effective Implementation
To conduct a thorough quality of earnings analysis, apply these practical strategies:
- Compare Net Income to Operating Cash Flow: A key metric is the ratio of Operating Cash Flow to Net Income. A ratio consistently greater than 1.0 suggests high-quality earnings, while a ratio below 1.0 may indicate that earnings are not being converted into cash.
- Scrutinize Revenue Recognition Policies: Look for signs of aggressive practices, such as "channel stuffing" (shipping excess inventory to distributors) or booking revenue for long-term contracts before the work is complete.
- Isolate Non-Recurring Items: Adjust earnings by removing the impact of one-time events like asset sales, litigation settlements, or restructuring charges to reveal the core, sustainable profitability of the business.
- Analyze Growth in Accounts Receivable: If accounts receivable are growing significantly faster than revenue, it could be a red flag that the company is booking sales that it may not be able to collect on, a key part of how to audit financial records. Learn more about auditing financial records and spotting irregularities.
8. Variance Analysis
Variance analysis is a powerful financial statement analysis technique that compares actual results against a predetermined benchmark, such as a budget, forecast, or a prior period. It moves beyond simply identifying that a change occurred, seeking to quantify and explain why the performance deviated from expectations. This method is crucial for internal management, performance evaluation, and strategic planning.
The core principle involves dissecting the total difference between actual and planned figures into its component parts, such as price, volume, and efficiency variances. This level of detail transforms a simple "we missed our sales target" into a clear story, for example, "we sold more units than planned, but at a lower average price, resulting in a net negative variance."
How Variance Analysis Works in Practice
The fundamental calculation is Variance = Actual Result - Budgeted (or Standard) Result. The key is then breaking this overall variance down into more specific, actionable components.
- Real-World Example: A manufacturing company might analyze its cost of goods sold. A negative variance (higher actual costs) could be broken down into an unfavorable material price variance (they paid more per pound for raw materials than planned) and a favorable material usage variance (their production process was more efficient, using fewer pounds of material per unit). This distinction allows management to address the specific root cause, whether it's procurement or production efficiency.
Actionable Tips for Effective Implementation
To make variance analysis a valuable tool for decision-making, implement these strategies:
- Focus on Significant Variances: Don't get lost in the noise. Establish a threshold, such as any variance greater than 5% or a specific dollar amount, to prioritize your investigation on what truly matters.
- Investigate Both Favorable and Unfavorable Variances: A favorable variance (e.g., lower-than-budgeted marketing spend) isn't always good. It could mean the team underinvested, potentially harming future lead generation.
- Break Down Complex Variances: Isolate the individual drivers. A sales variance can be deconstructed into price, volume, and mix components. This provides a much clearer picture than a single, aggregate number.
- Link Analysis to Corrective Action: The goal of variance analysis is not just to report differences but to drive improvement. Each significant variance should be tied to a clear action plan to either correct a problem or replicate success.
Financial Statement Analysis Techniques Comparison
| Analysis Type | Implementation Complexity 🔄 | Resource Requirements ⚡ | Expected Outcomes 📊 | Ideal Use Cases 💡 | Key Advantages ⭐ |
|---|---|---|---|---|---|
| Horizontal Analysis (Trend Analysis) | Low – straightforward calculations | Low – requires multi-period financial data | Identifies growth trends and fluctuations over time | Trend spotting, performance forecasting, anomaly detection | Simple, quick trend identification, cross-line comparison |
| Vertical Analysis (Common-Size Analysis) | Low to Medium – percentage conversions | Low – single period financial data | Reveals proportional relationships within statements | Size-neutral comparisons, cost structure analysis | Facilitates benchmarking and cost structure insights |
| Ratio Analysis | Medium – requires multiple ratio computations | Medium – detailed financial data and benchmarks | Multifaceted insights into liquidity, profitability, efficiency, and solvency | Financial health evaluation, peer comparison | Standardized, widely accepted snapshot across dimensions |
| Cash Flow Analysis | Medium – requires cash flow statement focus | Medium – detailed cash flow details needed | Liquidity and cash generation insights | Liquidity assessment, earnings quality check, distress prediction | Harder to manipulate, true cash position revealed |
| DuPont Analysis | Medium to High – decomposing ROE into components | Medium – detailed financial statement data | Driver-level profitability insights | ROE performance analysis, operational vs financial leverage assessment | Reveals ROE drivers and management improvement areas |
| Comparative Analysis (Benchmarking) | Medium – requires peer data collection | Medium to High – access to peer and industry data | Relative performance context | Competitive positioning, gap identification | Contextualizes absolute numbers, uncovers best practices |
| Quality of Earnings Analysis | High – deep and subjective accounting review | High – detailed footnotes and judgment required | Earnings sustainability and reliability assessment | Fraud detection, earnings quality evaluation | Early detection of manipulation, better future predictability |
| Variance Analysis | Medium – detailed variance breakdowns | Medium – budgeting data and actuals | Identifies causes of budget deviations | Performance management, budgeting feedback | Actionable insights, accountability, continuous improvement |
From Data to Decisions: Putting Your Analysis into Action
We have journeyed through a powerful arsenal of eight distinct financial statement analysis techniques, moving from foundational methods like Horizontal and Vertical Analysis to more nuanced approaches such as DuPont and Quality of Earnings Analysis. Each technique offers a unique lens through which to view a company's financial health, performance, and potential. Yet, the true mastery of financial analysis lies not in applying a single method, but in skillfully weaving them together to form a cohesive and comprehensive narrative.
Think of these techniques as a diagnostic toolkit. Horizontal Analysis reveals the direction a company is heading, while Vertical Analysis exposes the underlying structure of its finances. Ratio Analysis then acts as a magnifying glass, allowing you to scrutinize specific areas like liquidity, profitability, and leverage with precision. However, these numbers lack context on their own. This is where Comparative Analysis, or benchmarking, becomes indispensable, placing a company's performance against its peers and the industry at large.
Synthesizing Insights for a Holistic View
To elevate your analysis from mere calculation to strategic insight, you must synthesize the findings from these different tools. A declining profit margin identified through Ratio Analysis might be explained by rising costs of goods sold, a trend first spotted in a common-size income statement (Vertical Analysis). Similarly, a robust net income figure might seem impressive until Cash Flow Analysis reveals that earnings are not translating into actual cash, a potential red flag for poor receivables management or aggressive accounting practices.
This integrated approach creates a multi-dimensional picture, allowing you to:
- Validate Conclusions: Cross-reference findings from different techniques. If strong profitability ratios are supported by equally strong cash flow from operations, your confidence in the company's health grows.
- Identify Hidden Risks: A company might look good on paper, but a Quality of Earnings Analysis can uncover non-recurring gains or accounting choices that inflate its reported performance.
- Formulate Strategic Questions: Instead of just noting that inventory turnover is low, your combined analysis will prompt you to ask why. Is it a sales issue (Horizontal Analysis), a product mix problem (Vertical Analysis), or an industry-wide trend (Benchmarking)?
The First Crucial Step: Data Integrity and Efficiency
Before any of these sophisticated financial statement analysis techniques can be applied, you must overcome the initial, and often most tedious, hurdle: gathering, cleaning, and organizing the data. Financial documents, especially bank statements, often arrive in formats like PDF that are difficult to work with. Manually transcribing this data into a usable format like Excel is not only time-consuming but also fraught with the risk of human error, which can compromise the integrity of your entire analysis. An accurate foundation is non-negotiable.
Ultimately, mastering these techniques empowers you to move beyond the surface-level numbers. You learn to read between the lines, to understand the story the data is telling, and to translate that story into confident, strategic, and profitable business decisions.
Ready to streamline the most critical first step of your analysis? Eliminate manual data entry and ensure accuracy from the start. Try Bank Statement Convert PDF to instantly convert your PDF bank statements into analysis-ready Excel files, giving you more time to focus on what truly matters: uncovering insights. Visit Bank Statement Convert PDF to get started.