
A proper bank statement format in excel is more than just a digital copy of what you get in the mail; it's a dynamic, reusable system you build for true financial clarity. When you create your own custom template, you're not just organizing data—you're turning a messy, raw export from your bank into an actionable financial dashboard that works exactly how you need it to.
Why Bother Building a Custom Excel Statement?
Let's be honest—downloading a raw CSV file from your bank is usually the start of a tedious chore. You’re often stuck with poorly formatted columns, cryptic transaction descriptions, and a ton of manual cleanup before you can even begin to make sense of your finances. Sure, there are countless budgeting apps out there, but for total control and personalization, a custom Excel format is still one of the best tools you can have.
The real magic isn't just in organizing the numbers from one statement. It's about building a single, powerful template that becomes the backbone for your personal budget, small business bookkeeping, or even client expense reports. This approach turns raw, unhelpful data into genuine financial intelligence.
The Headaches of Standard Bank Downloads
Standard bank downloads are built to give you a basic record, not to help with analysis. This leads to some all-too-common frustrations that I've seen countless times:
- Inconsistent Formatting: Dates, numbers, and text get jumbled together, which means you have to spend time cleaning it all up.
- Vague Descriptions: Transaction details like "ACH/DEBIT-POS 12345" can be almost meaningless, making it tough to categorize your spending accurately.
- Repetitive Manual Work: You find yourself stuck in a loop, repeating the same cleanup process month after month.
The core benefit of creating a custom Excel template is reusability. You invest the time once to build a perfect structure, and from then on, you can just paste in new data each month. This saves hours and dramatically cuts down on errors.
The Power of a Structured Template
Even with all the new software available, Microsoft Excel has been a gold standard for financial reporting since the late 1990s, and for good reason. A 2022 survey found that around 65% of small businesses still rely on manual CSV imports for their bookkeeping. This really highlights how many people could benefit from a more efficient workflow.
A well-designed bank statement format in excel becomes your command center for financial reconciliation. For instance, having a clean, custom format is the first and most critical step before you can perform a bank reconciliation statement, and you can see an example of one here. This guide will walk you through building that essential foundation from the ground up.
Manual CSV Import vs Custom Excel Template
See how a dedicated Excel template transforms your workflow compared to repeatedly cleaning raw data files.
| Feature | Manual CSV Import | Custom Excel Template |
|---|---|---|
| Initial Setup | None. Just download the file. | One-time effort to build the structure. |
| Monthly Workflow | Tedious data cleaning every single time. | Simple copy-and-paste of new transactions. |
| Categorization | Manual and prone to errors. | Automated with formulas and drop-down menus. |
| Consistency | Varies with each download from the bank. | Perfectly consistent every month. |
| Analysis | Difficult; requires formatting first. | Instant, with charts and summaries ready to go. |
Ultimately, the template approach front-loads the work, saving you a massive amount of time and frustration in the long run.
Crafting Your Core Excel Statement Template
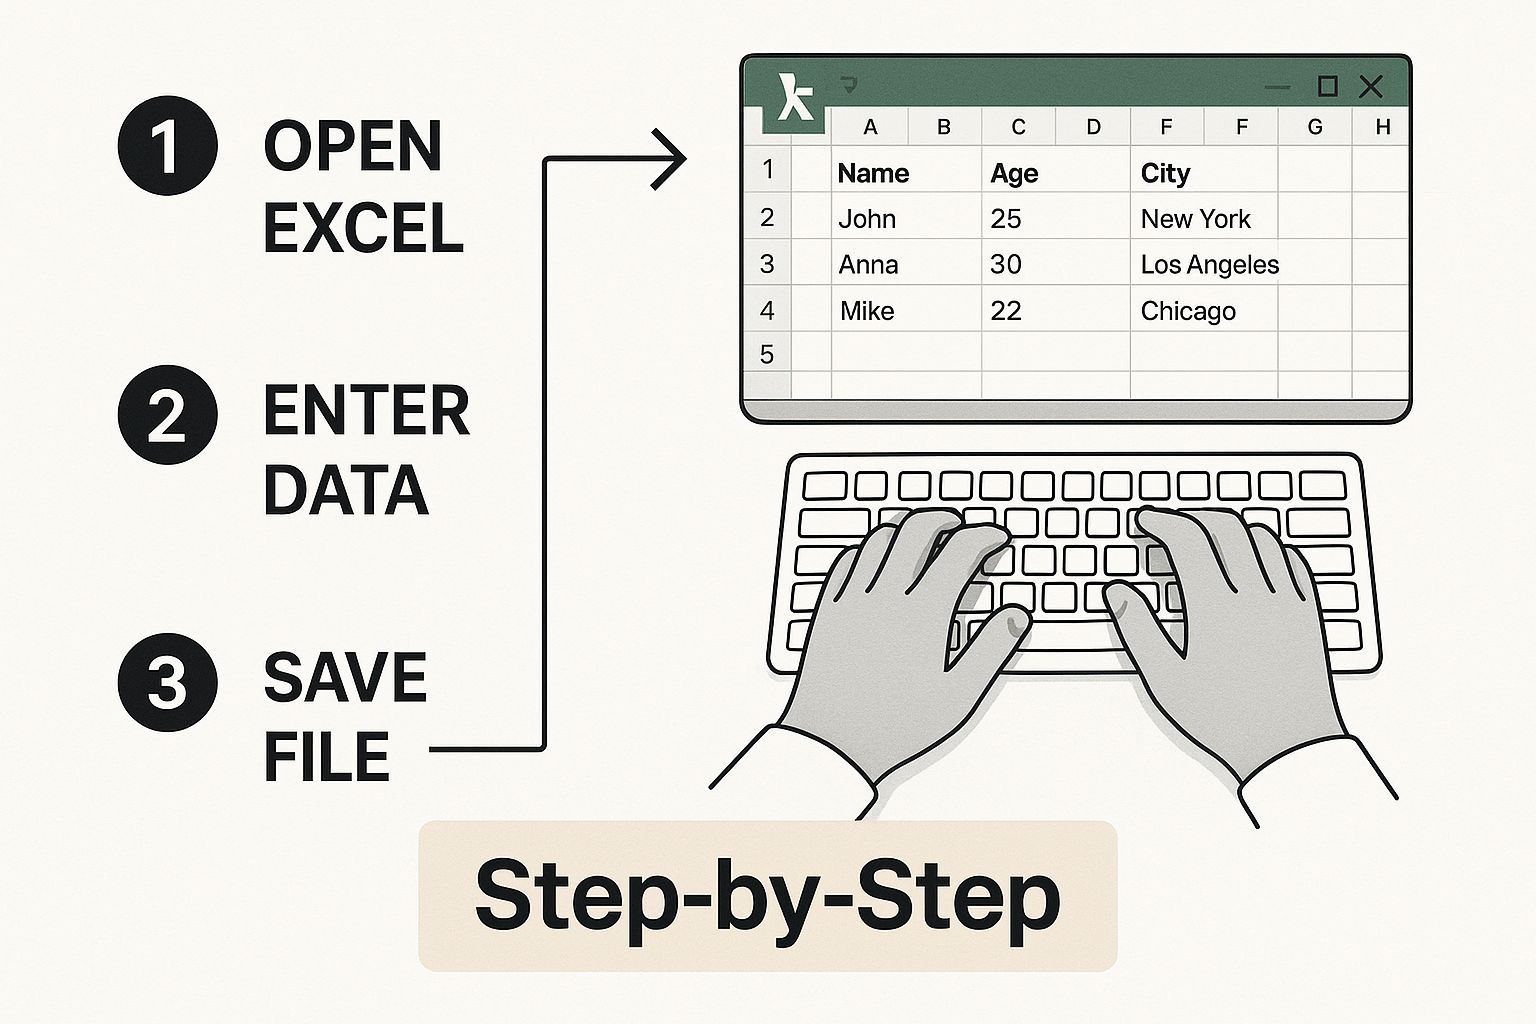
Alright, let's get our hands dirty and build the actual template. You can find plenty of pre-made templates online, but trust me, creating your own is the way to go. A custom bank statement format in excel built around your specific needs is far more powerful than any generic download. This is where we lay the groundwork to turn a pile of raw data into a genuinely useful financial tool.
Open up a fresh, blank worksheet. The first thing we need to do is set up our core columns. These are the non-negotiables, the absolute essentials that will form the backbone of your entire statement. I’ve found that these six headers are the perfect starting point for almost any situation:
- Date: The day the transaction actually posted to your account.
- Description: This is for the raw transaction text, exactly as it appears from your bank.
- Category: Your personalized label for the transaction (think Groceries, Utilities, Payroll, etc.).
- Debit: Any money that left the account.
- Credit: All money that came into the account.
- Running Balance: A live, auto-updating total of your account's balance.
Formatting for Readability and Function
Now that the headers are in place, it's time for a little formatting magic that makes a massive difference. First, select all your headers and a few rows below them, then head to the Home tab and click "Format as Table." This is my favorite trick. It instantly adds filter buttons and alternating row colors, which is a huge help for readability once you have a lot of data.
Here’s another small thing that saves a lot of headaches: freeze your header row. Go to the View tab, click Freeze Panes, and select "Freeze Top Row." Now when you scroll down through months or even years of transactions, your column titles will stay put. It seems minor, but it's a huge quality-of-life improvement.
The real aim here is to build a clean, functional, and visually organized worksheet before you add a single piece of data. Getting this foundation right makes importing and analyzing everything later on so much smoother.
One last setup task: get your data formats right from the get-go. Highlight the entire 'Date' column and set its format to Short Date. Then, do the same for your 'Debit,' 'Credit,' and 'Running Balance' columns, but choose the Currency format. Taking a minute to do this now tells Excel how to treat the data, which prevents a ton of frustrating formula errors down the road. With that, your template is prepped and ready for action.
How to Import and Clean Your Bank Data Like a Pro
A well-designed template is just the start. The real magic happens when you fill it with your transaction data, but let's be honest—getting the messy files from your bank to play nicely with Excel can be a real headache. I’ve been there. The good news is, with a few key tricks, you can turn this tedious chore into a quick, repeatable process.
Most banks let you download your transactions as a CSV (Comma Separated Values) file, which is perfect because Excel opens it right up. Sometimes, though, you're stuck with a PDF. When that happens, a dedicated conversion tool is your best bet for getting the data out cleanly. On the flip side, knowing how to convert an Excel file to CSV is a handy skill for moving data between different financial tools.
Once you have your data in a spreadsheet, the cleanup begins.
Mastering the Text to Columns Wizard
Have you ever noticed how banks love to cram everything into one column? You might see the date, a transaction code, and the description all mashed together. This is where Excel's Text to Columns wizard becomes an absolute lifesaver. It’s a powerful feature that lets you split the contents of a single column into several separate ones.
Getting your data structured correctly from the get-go is crucial. This is how you do it:
Following these steps will get your columns organized before you even think about plugging in formulas or building charts.
My Two Cents: Before you touch a single cell, always make a copy of your raw data. Trust me on this. It creates a safety net in case a cleaning step goes sideways, saving you from the frustration of having to download the original file all over again.
Essential Data Cleaning Functions
Even after splitting your columns, you'll probably still have some tidying up to do. There are two tools I use constantly for this.
- The =TRIM() Function: This little gem removes all the extra spaces from a cell, leaving just a single space between words. It’s perfect for fixing those annoying inconsistencies in transaction descriptions.
- Find and Replace (Ctrl+H): This is your go-to for getting rid of repetitive, useless text in bulk. For example, if every transaction starts with "TRN-ID:", you can find all of them and replace them with nothing. It's an instant cleanup.
These aren't just abstract functions; they're practical skills that turn a frustrating, error-filled manual task into a quick and accurate workflow. Once you get the hang of them, you’ll be able to make your data fit perfectly into your template every single time.
Making Your Template Smart with Formulas
Now for the fun part. With your data neatly organized, it's time to put Excel to work. This is where we transform a static list of transactions into a living, breathing financial tool. Formulas are the engine here, handling all the tedious calculations that are not only a time-sink but also a prime spot for human error.
The first and most crucial calculation we'll set up is the running balance.
This little formula is a game-changer, giving you a real-time update of your account total after every single transaction. Let's say your 'Running Balance' is in column F. The very first cell in that column (F2) will simply be your starting balance.
For the cell right below that (F3), you'll pop in a formula that takes the balance from the cell above, adds any income, and subtracts any expenses. If your credits are in column E and debits are in column D, the formula in cell F3 looks like this: =F2+E3-D3. Just drag that formula down the entire column, and Excel will handle the rest, automatically adjusting for every new entry. Simple, but incredibly effective.
Building a Summary Dashboard
Once your main transaction sheet is humming along, you can get a bit more sophisticated by building a summary dashboard on a separate tab. This is your financial command center. Two functions, in particular, are absolute lifesavers here: SUMIFS and XLOOKUP.
SUMIFS: This function is brilliant for targeted calculations. It lets you add up numbers that meet several conditions at once. For example, you could use it to see exactly how much you spent on "Groceries" in the month of March.XLOOKUP: This is the modern, more powerful big brother of the oldVLOOKUP. I useXLOOKUPall the time to automatically categorize transactions. You just create a simple table on the side with keywords (like "Starbucks" or "Shell") and their matching categories ("Coffee," "Gas"). Then,XLOOKUPscans your transaction descriptions and fills in the category for you. The time this saves is just phenomenal.
These automated calculations are what really unlock the power of managing your finances in Excel. They don't just save you hours of work; they create a reliable foundation for accurate reporting and financial reviews. For a more detailed walkthrough, our guide on how to perform a bank reconciliation on Excel is a great next step.
By weaving these formulas into your template, you're no longer just logging data—you're creating an interactive dashboard. Every time you add a new transaction, your summary updates instantly, giving you an immediate, accurate snapshot of your financial health. That’s the real magic of building your own solution in Excel.
Adding Professional Touches to Your Statement

Now that you have a solid, formula-driven template, it's time to add the finishing touches. These are the details that transform your spreadsheet from a simple data log into a genuinely professional tool. These features don't just make your bank statement format in excel look better; they also boost its functionality and cut down on frustrating data entry errors.
One of the most impactful yet simple additions is Data Validation. Instead of manually typing categories like "Groceries" or "Utilities" for every transaction—and inevitably creating typos—you can set up a dropdown list. This tiny change ensures every entry in your 'Category' column is perfectly consistent, which is crucial for getting accurate summary reports.
Make Your Data Visually Intuitive
Beyond just organizing numbers, you can make your data speak to you using Conditional Formatting. This feature is a game-changer. It automatically changes a cell's appearance based on what's inside it, drawing your eye to what matters most without you having to hunt for it.
Here are a few practical ideas:
- Highlight any expense over $500 in red.
- Turn all income deposits green.
- Automatically bold any transaction from a specific source, like "Amazon" or "Costco."
Suddenly, that wall of numbers becomes an insightful dashboard. You can spot large expenses or recurring payments in a split second.
The goal here is to build a statement you can understand instantly. Little touches like dropdown menus and color-coded cells aren't just for show—they enforce data consistency and provide immediate analytical value, speeding up the entire reconciliation process.
From Numbers to Insights with Charts
Finally, let's bring your financial summary to life with a few charts. Numbers in a table are one thing, but a visual tells a story. A simple pie chart built from your category totals can show you exactly where your money went last month. A line chart is perfect for tracking your balance over time, giving you a clear picture of your financial health.
Making these charts is easy. Just select your summary data, head to the Insert tab in Excel, and pick a chart type that makes sense for your data. These visuals are what turn your spreadsheet into a true financial dashboard. This level of clean, visual data is also essential for more formal documents, a concept you can explore further with this bank reconciliation statement template.
Answering Your Top Questions
Once you have your bank statement format in Excel dialed in, you'll probably start wondering how to make it even more efficient. I've been there. After doing this for a while, a few common questions always come up. Let's tackle them head-on.
A big one is about automation. Manually downloading CSV files every month gets old, fast. Can you connect Excel directly to your bank? The short answer is yes, with a couple of caveats.
If you're comfortable with more advanced tools, Excel's Power Query feature (you'll find it under the "Get & Transform Data" tab) can sometimes pull data from web sources. This works if your bank has a stable online portal, but it's not a simple point-and-click setup and requires some technical know-how.
For a much easier route, I often recommend third-party add-ins. A great example is Tiller, which securely connects to thousands of different banks and automatically pipes your transaction data right into a spreadsheet. It completely skips the whole manual download dance.
How Do I Handle Multiple Bank Accounts?
This is probably the most common question I get. You've got a checking account, a savings account, maybe a credit card—how do you manage them all in one Excel file without creating a mess? You have two solid strategies, and the one you choose really depends on your goal.
-
Separate Tabs for Each Account: The simplest approach is to create a different worksheet (a tab at the bottom of Excel) for each account. You'd just duplicate your formatted statement template for each one. This keeps everything neat and tidy, with each account's data living in its own space.
-
Create a Single "Master" Sheet: This is the power-user method. You use one single transaction log for everything and just add a new column called "Account" or "Source." You then label each transaction with the account it came from (e.g., "Checking," "Visa," "Savings").
Honestly, I almost always go with the single master sheet. It takes a little more discipline upfront, but the payoff is huge. It lets you build PivotTables or use
SUMIFSformulas to see your entire financial world from one dashboard, which is incredibly powerful for budgeting and analysis.
Protecting Your Formulas From Accidental Edits
After spending all that time crafting the perfect formulas, the last thing you want is to accidentally type over one and break your whole sheet. It happens to the best of us. Thankfully, Excel has a built-in feature to prevent this.
The trick is to use the "Protect Sheet" function. But first, you have to tell Excel which cells you do want to edit.
Simply highlight the cells where you'll be entering your transaction data (like the date, description, and amount columns). Right-click, choose "Format Cells," go to the "Protection" tab, and uncheck the box that says "Locked."
Now, head over to the "Review" tab in the ribbon and click "Protect Sheet." You can add a password if you want. This locks down every cell you didn't just unlock, safeguarding all your precious formulas while leaving your data entry columns open for business.
Still stuck with stubborn PDF bank statements that refuse to be copied and pasted? Bank Statement Convert PDF is designed for exactly that problem. Our tool turns those locked-down PDFs into perfectly organized Excel files, saving you from hours of tedious work. See how it works at Bank Statement Convert PDF.